- Beaker 3 = 1.0% solution, labelled “1.0%”
- Beaker 4 = 1.5% solution, labelled “1.5%”
- Beaker 5 = 2.0% solution, labelled “2.0%”
- Beaker 6 = 2.5% solution, labelled “2.5%”
- Beaker 7 = 3.0% solution, labelled “3.0%”
- Wait approximately 1 hour.
- Remove potato pieces, one beaker at a time, and record the average percentile increase or decrease of each beaker. NB. Blot each piece of potato before measuring!
Preliminary prediction
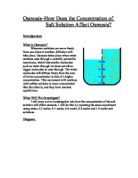
I predict that the cells of the potato pieces in water will become turgid, because the water will go through the membranes in the cells, which are semi-permeable membranes and enter the vacuole. This will push the cytoplasm against the membrane, which will increase the support given by the cell wall.
I also predict that in the high percentage salt solution, the cells will become flaccid. This is because the solution in the vacuole will be weaker than outside and so the water will move through osmosis out of the cell vacuole.
Preliminary results
All segments started at 15mm.
Preliminary Conclusion
My preliminary results had no pattern to them, which suggests that the % strengths of sugar solution were incorrect. I then tried percentages from 0% to 10% salt solution, going up in steps of 2% (i.e. 0%, 2%, 4%, 6%, 8%, 10%). This also proved unsuccessful, so I will try 0%, 5%, 10%, 15%, 20% and 25%.
Revised prediction
See “PRELIMINARY PREDICTION”
Revised Method
See “PRELIMINARY METHOD”, but change the amounts stated in “PRELIMINARY CONCUSION”
Revised Equipment
- 6 beakers (250ml each)
- 6 x 100ml strengths of salt solution (0%, 5%, 10%, 15%, 20%, 25%)
- Potatoes
- Ruler
- Knife
- 6 gauge cork borer
- Knife
Revised Results
Revised Results (Graph)
Conclusion
In this experiment I have found out that the strength of salt solution does affect the rate of osmosis in a potato. When the solution was strengthened, the samples of potato became more flaccid, and therefore shorter. This can be seen on the graph; as you progress along the x-axis (“Strength of solution (%)”), the value along the y-axis (“Increase or decrease after 1 hour (%)”) decreases, e.g. between the x-axis values of 10% and 15%, the y-axis value decreases from +7.7% to –2%. (This also can tell us that the solution inside the cells of a potato is between 10% and 15%, as the y-axis value of 0% lies in-between the x-axis values of 10% and 15% - from the line of best fit on the graph, I predict the value would be approximately 14%).
My results support my prediction insofar as the cells of the potato pieces in water did become turgid, and the cells in a strong concentration of salt solution became flaccid. I didn’t make a prediction about specific percentages of salt solution.
Evaluation
I believe my results are accurate because there does seem to be a continuous pattern between different results, and the spread of the graph appears to be fairly even. I encountered one anomalous result. I recorded no change for the 1st piece tested in 0% solution, when the rest of the results labelled “piece #1” shows a trend, and pieces #2 and #3 are grouped very close together (17mm and 18mm respectively), and piece #1 was out of synch with them, reading 15mm (no change). I believe that the reason for this anomaly is that I cut the piece slightly too short during preparation.