They contain an enzyme which turns Glucose into a type of Alcohol (ethanol) and carbon dioxide. This transformation process is known as fermentation. The alcohol which is created is used for many purposes. It is mainly used in the production of alcoholic drinks but it can also be used as an industrial cleaner, which dissolves grease but leaves no wet residue, or as a scent carrier in perfumes.
However when the alcohol concentration reaches 10% the alcohol begins to affect the yeast and fermentation stops.
Yeast is a very important which is needed when making bread dough. It makes the bread rise by filling it with carbon dioxide bubbles which are produced from the fermentation. Any alcohol which may be created as well as the bread is evaporated as the temperature bread is cooked in is very hot.
There are several factors which may affect the rate in which the yeast will rise:
When yeast is exposed to temperatures lower than 10°C it will not perform as intended to, although some forms of yeast can survive in artic conditions which are well below 0°C. Yeast will grow at temperatures ranging from 10 °C to 37 °C but any higher than 37 °C and the yeast will begin to denature and not function as they are intended to.
The pH level of the dough has little effect on the rate of fermentation unless it drops below 4.0. This is due to the fact that in acidic conditions the cells of the yeast will begin to denature.
In this investigation I will investigate how changing the temperature affects the yeast and fermentation. I will start by splitting some fresh bread dough (made with yeast) into five different pieces (approx 60grams each). I will push these pieces to the bottom of five different measuring cylinders and will keep them at controlled temperatures in water baths. I will record the starting volume of the dough and will note how much the dough has risen after every five minutes. I will start at five minutes and go up in five minute intervals until 30mins is reached.
This will give me a table of results for which I can draw a graph and analyse against the other tests.
I will carry out this same test for five different temperatures and will use the same procedure for each so that my experiment will be fair tests. These five different temperatures will be 21˚C, 30˚C, 40˚C, 48˚C and 58˚C.
I will get two sets of results for each temperature so that I can take an average which will make my results more accurate and even out any anonymous results which I might get.
I will keep this experiment a fair test by doing several things:
- Using the same amount of bread dough with the same amount of yeast for each different temperature.
- Pushing the dough down the same amount in the measuring cylinder.
- Recording the rise in dough at the same times for each test.
- Only ever change one factor.
If I stick to these three things I know my test will be fair and so I will obtain a good set of results for which I can draw a graph which will help me to analyse my results, however as the yeast dough will be made before I do my experiments it will already have started rising before I can leave it at the right temperature. Although it should not affect my investigation too much, I can not avoid this problem but to try to minimise it will try to make the time in-between it’s made and when I do my tests as small as possible.
It will be kept safe by me making sure that the water bath which keeps the dough at certain temperatures is in the centre of the table as a spillage of hot water could cause a nasty burn.
Here is a table showing my factors I will change, keep the same (control) and measure.
I will now Predict what I think will happen in this experiment:
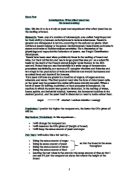
Prediction:
I predict that the fermentation will occur fastest between temperatures 30 - 40˚C and so the volume of yeast will be biggest after 30 minutes with dough that has been kept at these temperatures. This is basically because the optimum working temperature for the yeast to ferment is around 37˚C. The higher temperature samples will probably ferment faster at the start as they would still be warming up but as the correct temperatures are reached in these, the yeast will begin to denature and not perform as intended. The yeast will also begin to shrink and this is because carbon dioxide bubbles (which make the dough rise) are produced in fermentation and these will cease to be produced and so will escape causing the dough to lose volume and shrink / collapse. I also think that the further away from the optimum temperature, the less the yeast would ferment and so less carbon dioxide bubbles would be produced and the less the dough would rise.
I am now able to predict that the best temperature for fermentation in my experiment will be 30˚ as the next higher temperature is 48˚C, by which time the yeast will have started to denature and fermentation will not occur as fast.
This is a predicted graph which shows what I think the final averaged results graph will look like.
This is a time / growth graph which shows the fast start of the fermentation as the yeast are warming up. But as the temp gets towards 40 - 50˚C, the yeast start to denature and no more carbon dioxide bubbles are produced to make the dough rise. Therefore, the dough actually loses growth as the carbon dioxide bubbles escape.
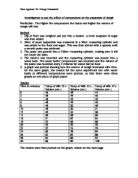
I will now record my results which I have obtained in a table,
Results:
Now I have recorded my average results in a table I will plot these onto a time / growth graph just like my predicted graph. This will enable me to analyse my results and will help me to look for any anomalous results.
On my graph I will have a different colour line for each different temperature. This allows me to easily compare results.
Graphs:
Conclusion:
From looking at my graph, I can clearly see that the best suited temperature for this yeast was 30˚C. This was because the average of the two results for this temperature after 30 minutes was 102cm3. This was a larger volume than any of the other average and so it had grown the most at this temperature and in fact by 50cm3. As the temperature got above 30˚C to 48˚C and 58˚C, it was evident that the yeast started to denature and although still producing some carbon dioxide bubbles through fermentation, the amount produced was not as much as it was at 30˚C.
Therefore my prediction was correct as I stated that the best temperature for the yeast would be 30˚C and it was as I just said above.
My prediction was also correct when I said about the further away from the optimum temperature of the yeast, the less carbon dioxide bubbles the yeast will produce. I know this part was correct as the volumes of the dough decreased as the temperature got higher after 30°C and the dough volumes increased from the starting volume to when it got to 30°C.
For example there is a noticeable difference between 20 - 30°C (with a maximum volume difference of 16 cm3) and also a difference between 48°C and 58. The 20°C temperature did not ferment and make the dough grow very well because yeast requires more heat so that it can respire and give off carbon dioxide bubbles which make the dough rise.
At the higher temperatures the dough begins to collapse. This is because the heat becomes too much for the yeast and causes them to denature and the production of Carbon Dioxide stops allowing carbon dioxide bubbles to escape which leads to the dough collapsing on itself and losing volume, as shown in my results table for the 30 minute volume of the 58°C test.
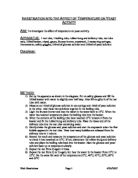
Evaluation:
From looking at my results I cannot see too many flaws in the results but there is one which is not as it should be. In the 40°C water bath between times 15 and 20 minutes, the dough is growing well until it collapses on itself after reaching 94cm3.
It then loses volume and quickly becomes 82cm3 as it was on the 10 minute reading.