Key Factors
There are several factors that can greatly effect the experiment. The main factor is of course the temperature of the water which we will control (as mentioned above temperature can change the reaction rates severely). If we decide to shake the test tube, then we must do so for every reaction, shaking the test tube will increase the rate of reaction and therefore must be kept constant. The amount of the solution is also a factor which we must control, but using pipettes this will not be very hard.
Diagram
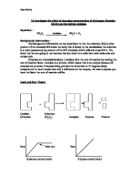
Apparatus
Here is the apparatus we will use:
- Burette
- Boiling tube
- Delivery tube
- Water bath
- Pipette
- Measuring cylinder
- Clamp & stand
Method
Temperature will be pre-set by a water bath, the starting temperature will be 13°C (roughly room temperature). We will take readings from 0-200seconds and repeat one experiment to see if our results are accurate.
Here is what we will do:
- We will set up the equipment as shown above.
- We will fill the burette with water and place it upside down in the water bath.
- A boiling tube will be set up and a delivery tube will connect it with the burette in the water bath.
- We will then measure out 12cm³ of water and place it into the boiling tube. Using a pipette for greater accuracy, we will measure out 1cm³ of yeast and 2cm³ of Hydrogen Peroxide.
- The yeast and water will be placed in the boiling tube and then once we are ready we will add the Hydrogen peroxide.
- Simultaneously the Hydrogen peroxide will be added, the stopper placed on the boiling tube and then stop watch started.
- We will then measure the amount of gas produced every 10 seconds, recording our results up to and including 200 seconds.
- We will then change the temperature of the water bath to varying temperatures listed in the results table and repeat the experiment.
Results
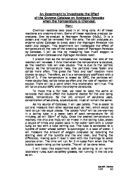
Analysis of Graph
The graph is made up of several curves, which start at the origin. This tells us that the volume of gas produced (rate of reaction) is not directly proportional to time. Here is a summary of what our graph shows:
- The points make an obvious pattern.
- The graph shows that volume of gas produced increases as time goes by up until a certain time at which it stops reacting.
From the graph we can see one or two very small anomalies but they are not off by much. This could be due to the apparatus and procedure methods. Using more accurate equipment and taking more care when preparing the experiment could reduce these anomalies. Another source of error is the shaking of the test tube, if all the experiments were not shaken the same amount at the same time the graphs could be off.
Conclusion
“I predict that as temperature increases so will the rate of the reaction (up to a certain temperature, at which it will no longer ‘function’)”
As shown in my results table, and more clearly my graph, you can see what I found supported my prediction mentioned above. However, the temperature at which I predicted that the yeast would not function was off. We operated the experiment at two extremes temperatures, 13°C and 60°C. At these temperatures there was a change in the rate of reaction, however, this change was not as much as I predicted. The gap between the most gas produced and the least is only 10cm³. What is most surprising is that the enzyme reacted quite well at 60°C, at this point I would have thought it would have denatured. It also didn’t react as slow as I thought it would at 13°C which is also surprising. In my background information I included that the optimum temperature for yeast would be around 37°C, however, after the experiment it seems the optimum temperature would be somewhere between 50°C and 60°C.
Evaluation
Although the experiment was reasonably accurate, some of the results we took are bound to be off, and as you can see from my graph some of them are. However, they are not off by much at all. To test my results for lack of accuracy I did the first experiment twice and compared those results. From this I found that the end amount of gas produced was 5cm³ more than it was the second time I did the experiment.
Errors in the experiment can be due to several factors. These factors are the ‘key’ factors mentioned above. These key factors are factors that could change the results by varying amounts if they are not constant.
These factors are basically:
- Time
- Temperature
- Amount of Hydrogen Peroxide used
- pH of the solution
- Shaking of the test tube
We tried to keep these values at a constant and tried to repeat each experiment exactly the same as the last one. However, in experiments where readings are required to be read off a scale there will be a lot of human error.
Improving the Experiment
There are only a few ways in which we could improve the experiment, and it is likely the highest sources of error came from human error.
However, we could always increase the accuracy of the results by using more accurate equipment, such as an Electro thermostatically controlled water baths which are precise to 0.05°C. Gas syringes would also be a possibility to us. Whether gas syringes would be more accurate or not is not sure, but the scales might be easier to read and therefore reduce human error.