“As a light source moves farther from an object, the light shining on it becomes less intense. When the distance is doubled (between the light source and the point where light is measured), the light intensity is quartered.”
So, to find the light intensity at a certain distance, I will use:
1
d²
Predictions
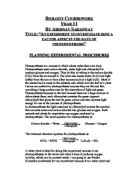
Because of the Inverse Square Law, I predict that as the distance of the lamp to the pondweed increases (and light intensity decreases), the rate of photosynthesis will decrease, and when the distance is lower (and light intensity is high), the rate will increase. However, when the light intensity reaches a certain point, the bubble rate will stop increasing. This is because of Blackman’s Law – when the light intensity is high, it will no longer be the lowest limiting factor, and so another factor will determine how high the rate of reaction can go. When the saturation point of light is reached, increasing the light intensity more will have no effect on the rate of reaction.
I have drawn a graph of my predicted results.
As you can see on the graph, the rate of photosynthesis increases before slowing down and then stopping completely, when another factor becomes the limiting factor. Every time the distance is doubled, the light intensity will be quartered. So, as the distance is increased, the gradient on the graph will be steeper.
Preliminary Experiment
I conducted a preliminary experiment to determine certain things I need to take into account in the final investigation. The basic method was the same as the final method I will be using which can be found at the end of this plan section, except that I counted the number of bubbles for two minutes instead of one. Below are my results:
I discovered a number of things from this:
- I must repeat each reading I take as the rate of photosynthesis can vary greatly. I will take three repeats for each distance of the lamp away from the pondweed, as if I take two and find the average, one of them could be unreliable and effect it. However, if three repeats are taken, if one looks a long way away from the other two it can be ignored.
- It takes a while for the pondweed to adapt to different light intensities. Due to this I must leave the pondweed for 5 minutes whenever the distance of the lamp to the pondweed changes.
- I must collect a wide range of results so I can determine the light saturation point. When the final experiment is to be carried out I will have just over an hour to collect readings, due to time restrictions. Using the two points above, I have decided I will have enough time to take 7 different readings with three repeats each. They will be at 5cm, 10cm, 15cm, 30cm, 50cm, 70cm and 90cm.
- The pondweed must be upside-down, or else bubbles of oxygen will get trapped on the leaves. Also, the end of the stem cannot touch the sides of the boiling tube or bubbles can get caught.
-
The end of the pondweed will be cut at 45o so the bubbles can escape it with ease. Only the bubbles that come out from the end of the pondweed will be counted. The cut should be made away from any leaves, as they can impede the expulsion of bubbles from the stem.
- The number of bubbles released changes greatly with different pieces of pondweed. I will only use one throughout the whole of the experiment.
- With some pieces of pondweed bubbles are released very quickly, so that they are hard to count. To get around this, I will have a piece of paper and pencil, and make a dot every time I see a bubble released and at the end count the dots.
- I will use sodium hydrogen carbonate for the solution in which the pondweed will be placed, as a much slower bubble-rate is achieved with water, which would cause no bubbles to be released at high distances.
- To measure the distance of the lamp to the pondweed, I will make a mark with chalk on the desk, in line with the centre of the pondweed, and measure to the end of the lamp.
- I found that the water changes temperature when the lamp gets close, so I will monitor it.
- A razor blade will be used in the experiment to cut the end of the pondweed cleanly, so care will need to be taken with this. I will need to make sure that water is not spilled near any electric sockets so there is no risk of being electrocuted. The lamp will be on for virtually all of the time the experiment is taking place, so it will get hot. I must make sure not to burn myself on it.
- The closer distances should be recorded first, as they start the plant photosynthesising
- The equipment I will need is:
Beaker
Lamp
Sodium Hydrogen Carbonate
Water
Stand
Ruler
Pondweed (Elodea)
Thermometer
Clamp
Boiling tube
Chalk
Paper
Pencil
Stopwatch
I will set up the apparatus like this:
Method
The apparatus will be set up as shown in the diagram above. The pondweed’s end will be cut at a 45-degree angle. I will draw a chalk marking in line with the pondweed where my distances will be measured from. The lamp will be set at a specific distance from the pondweed, measured with the ruler to the closest part of the lamp. I will read the temperature of the water bath with the thermometer and record it. Next the lamp will be switched on, and using a stopwatch I will time for five minutes while the pondweed acclimatises. As soon as they are up, I will reset the stopwatch, and start it again. Now, for a minute I will make a mark on a piece of paper every time a bubble is released from the stem of the pondweed. At the end of the minute I will count how many dots have been made, and record the result in my results table. Now, I will count the bubbles twice again for a minute, and record these repeats. After they have been completed, I will take the temperature on the water bath again with the thermometer, then set the lamp to another distance from the pondweed, using the chalk marking, and repeat this whole process again. I have drawn a results table below where I will record my results.
Results Table
* This result was ignored when calculating the average.
Analysis
I drew two graphs of my results; one showing distance against rate of photosynthesis, and the other showing light intensity against rate of photosynthesis. On the graph showing light intensity against rate of reaction, the line slopes with a positive gradient, but gradually flattens out as the light intensity gets higher, until it is parallel to the X-axis. This means that as the light intensity increases the rate also increases. However, if the light intensity continues to increase, each time it is increased the rate will increase by less and less, until having a higher light intensity does not increase the rate of reaction. This is because the light saturation point has been reached, and the light intensity is no longer the lowest limiting factor, and Blackman’s Law states that the lowest limiting factor is the limiting factor for the whole experiment.
My results match what I expected in my prediction. My predicted graph of results is roughly the same shape as my proper results. As the distance from the lamp to the pondweed increased (and light intensity decreased), the rate of photosynthesis decreased, and when the distance was lower (and light intensity was high), the rate increased. However, when the light intensity reached a certain point, the bubble rate stopped increasing. This is because of Blackman’s Law – when the light intensity was high, it was no longer the lowest limiting factor, and so another factor determined how high the rate of reaction could go. When the saturation point of light was reached, increasing the light intensity more had no effect on the rate of reaction.
The distance to rate graph shows that as the distance increases the rate of reaction decreases. The best-fit line has a negative gradient, which is very steep at short distances, but gets shallower, before becoming flat at high distances. This means that at short distances the rate of photosynthesis is high, and at large distances it is low. The rate does not go down to 0 bubbles per minute at high distances because there are other light sources affecting the rate of photosynthesis.
The light saturation point was at a light intensity of 216 on my graph.
Evaluation
In my experiment I measured the rate of photosynthesis at seven different distances, taking three repeats each time. Although the range of my results was acceptable, I think I should have taken readings at more distances, especially at higher light intensities, so I could plot the light saturation point more accurately. Also, my results would have been more accurate if I had taken more repeats. I think the experiment was a success, because I obtained enough results to plot a graph that was similar to my predicted graph.
My result for 50cm did not fit in with my other results – it was anomalous. The reason for this could be because the temperature was a lot higher during that experiment (28-29o), which would make more particles pass the activation energy for photosynthesis, and so speed up the reaction and make the plant release oxygen faster. Also, human errors probably affected some of the results; these would include miscounting the number of bubbles, not setting distances precisely and jogging the desk which could release bubbles that would not be released otherwise.
The variables were controlled fairly well:
Number of chloroplasts – I didn’t change the piece of pondweed. However, I had no way to make completely sure that this didn’t change, or any way to monitor if it did change.
Carbon dioxide – the pondweed was submerged in sodium hydrogen carbonate which made excess carbon dioxide available, so this was controlled well.
Temperature – I used a water bath to try to keep the temperature constant. However, it did vary a lot (8o). To improve this, an electronically controlled water bath could have been used, which would keep the temperature more constant.
There are a number of pieces of apparatus I could have used to improve the results I obtained:
- Thermocouple – a very accurate thermometer that works by calculating the temperature using potential difference.
- A light meter could be used to measure the light more accurately.
- To measure to volume of oxygen let off by the pondweed, I could have placed a measuring cylinder upside-down over the top of the pondweed, and read off at the end the volume from the measuring cylinder.
With more time, as I have already mentioned, I could take more repeats and more readings at different distances. I could also take the readings for longer, and give the plant more time to acclimatise to different distances.
To make the results more reliable I could have the lamp as the only light source, i.e. keep the pondweed in an unlighted room apart from the lamp.
I think my evidence is sufficient to support my conclusions, because it matches almost perfectly with my predicted results. My results agree with the scientific theory I suggested.
If I were to take this experiment further, I would investigate how the rate of photosynthesis changed at different temperatures.