Reactant concentration in the solution becomes much less near the solid, which tends
To settle out. At the bottom of the flask the reaction prematurely slows down
Distorting the overall rate measurement and making the results uneven and
Therefore inaccurate.
Type of Potato: The type of potato used will affect the experiment because different types of
Potato will contain different levels of Catalase, and may have different Ph Levels. If two different types of potato are used during the experiment, the
Results will be inaccurate.
I will be investigating what effect the changing temperature will have on the reaction rate between the hydrogen peroxide and Catalase. I will be conducting the experiment using five different temperatures 10°C, 20°C, 30°C, 40°C, and 50°C. I am using these temperatures so that there is a range of high to low results, also I will be getting a reading when the 2H2O2 is at it’s optimum temperature. Each of these I shall repeat 3 times to make sure the results are reliable, and so I can obtain an average.
Hypothesis:
The rate of reaction of Catalase and hydrogen peroxide will be significantly affected by the temperature change of the hydrogen peroxide.
Evidence
Michaelis and Menton (1913) described the change in the rate of reaction of an enzyme-catalysed reaction when the concentration of substrate is changed. This led to many rate studies on enzymes being carried out in which it was found that as well as changes in enzyme and substrate concentration, “an enzyme’s catalytic activity is strongly affected by temperature and pH conditions” (Michaelis, 1913). (Source found at )
Gareth William’s book “Biology for you” states that “ Temperature is one of the factors that effects enzyme activity.” (Source found in “Biology for You” By Gareth Williams)
Prediction
I predict that an increase in temperature of the hydrogen peroxide will increase the kinetic energy of the substrate and enzyme molecules. This will cause them to collide more often and more powerfully with each other, which will increase the rate of reaction. The reaction will support the Q10 rule, i.e. a 10°C rise in temperature will result in a doubling of the reaction rate. This will only occur up to around 40°C because a rise in temperature causes the atoms making up enzyme molecules to vibrate.
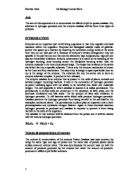
This will break the hydrogen bonds holding the Catalase molecules in their precise three-dimensional shape and, therefore, denature the enzyme so that the hydrogen peroxide molecules can no longer fit the active sites. Catalase will have an optimum temperature of about 40°C and this will be the temperature where the rate of reaction will be at it’s highest. It will be after this temperature when denaturisation will begin to have an affect on the Catalase enzymes and the rate will begin to decrease. On a graph, I expect the shape of the line, in correlation with my results, to look similar to this.
Most oxygen produced here
At the start. Optimum Temperature (approx 40°C)
The descending portion of the
Curve above, reflects the loss
Of catalytic activity as the
Enzyme molecules become
Denatured at high temperatures.
Background Information
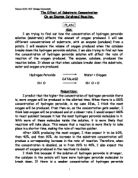
Enzymes are naturally produced in our bodies, and are able to increase the rate of reaction without actually being consumed in the process. In all, enzymes are very efficient. Small quantities at low temperatures are able to produce results, which would require high temperatures and a violent reaction from any normal chemical means. Although increases in temperature may speed up the reaction, enzymes are unstable when heated. The structure of an enzyme looks like this:
Diagram of the Reaction between Catalase and Hydrogen peroxide
Enzyme function can be explained by the Lock and Key Hypothesis: the active site of an enzyme (the lock) has a specific shape in which only the precise amount of substrate (the key) will fit – forming an enzyme-substrate complex. Therefore producing a product. The active site is a small hollow in the enzyme molecule that exactly fits the 3-D shape of the substrate.
All enzymes have the following 4 properties:
- All enzymes are proteins (amino acids, and polymers)
- Enzymes are catalysts
- Enzymes are denatured by high temperatures
- Enzymes work best at a certain pH (normally 7 & 8)
Preliminary Experiment
Before I started this piece of coursework, I carried out a piece of Preliminary Work. This involved carrying out a basic experiment, to see what would happen if you change the temperature of the hydrogen peroxide and add the Catalase enzyme to it. The experiment was carried out in a similar way, as my main experiments will be, except for the fact that this was only a single experiment, and not repeated for accuracy. I will be using the same equipment (see list on next page), the same concentrations of hydrogen peroxide and Catalase. This is to see what results I am likely to get in my main set of experiments, and to see if there are any ways that I could improve upon my methods.
Method for Preliminary Experiment
- I used all of the apparatus below, and set it out as shown in the diagram.
Apparatus
-
1x – Knife - for cutting up the potato
-
1x - Ruler (mm units) – for measuring the length of the potato
-
1x - Ceramic tile - for cutting the potato on
-
1x - Conical flask (with rubber bung) – where the reaction will take place
-
1x - Stand, boss, clamp – for holding the plastic measuring cylinder inside down
-
1x - Delivery rubber tubing (3mm diameter) – for the oxygen to travel through
-
2x - Glass beaker – to measure the water for the plastic tub
-
2x - Thermometer (0-100oC) – to monitor the temp of the hydrogen peroxide and room
-
1x - Syringe or pipette (5cm³) – to accurately measure out the hydrogen peroxide
-
1x - Stop clock – to time the rate of reaction
-
1x – Container of hydrogen peroxide – substrate for the reaction
-
1x – Potato – catalyst for the reaction (Catalase)
-
1x - Water bath – to heat the hydrogen peroxide to the right temperature
-
1x – plastic measuring cylinder (mm units) – hold the water which will measure the oxygen level
-
1x – Plastic tub – to hold the water inside the upside down measuring cylinder
-
1x – Electronic scales (accurate to ) – to weigh the potato pieces
I have decided to use this equipment, because it is reasonably accurate, and is easily accessible to me. This equipment isn't as accurate as I would have liked, but due to the equipment I have available to me this is the best that I can use.
- To make sure the experiment was safe I only got out the equipment I needed to use, so that there was no loose equipment to injure people. I made sure none of the equipment was damaged, and that all the pieces were kept away from the edge of the lab bench. I wore safety goggles to avoid any splashes of chemicals damaging my eyes. I washed my hands, and all of the apparatus before and after the experiments to avoid any contamination.
- Before I started I washed and dried all the equipment to ensure there was no contamination from any previous experiment. I also washed and dried all the equipment between each section of the experiment.
-
To ensure my results were as accurate as possible I used a digital stopwatch, graduated measuring cylinders and measuring tube. The Catalase enzyme in a potato was used for this investigation. I kept the following variables the same:
- 5 pieces of potato
- Each weighing 3.4gms
-
Volume of the 2H2O2 was 20ml
-
Concentration of 2H2O2 was 20V
-
Ph of the 2H2O2 was 8 (alkaline)
- Volume of water in the measuring cylinder will be 100.0ml
- Room temperature is 25ºC approximately
-
When all the apparatus was set up, and I had started the experiment, I started of by using a knife to cut my potato into 1-inch thick strips. The strips were placed on a ceramic tile and a knife was used to cut them into 3cm in length.
- The weight and lengths of the strips were measured as accurately as possible by placing the strips against a ruler with millimetre units marked on, and then weighed on the electronic scales.
- A tub was filled half way with water, and a plastic measuring cylinder was also filled with water and placed up side down into the tub to hold the water inside. The stand, clamp and boss were used to hold the cylinder in place, and the bung was removed from the flask. The rubber delivery tube was placed inside the measuring cylinder, and the other end was fitted into the bung with a hole, free to collect the oxygen being produced in the flask.
- A small measuring tube was used to place 20cm³ of hydrogen peroxide solution at pH 8 into the glass flask. This was then put into a water bath, to increase the temperature to 27°C.
-
Care was taken to count 5 potato pieces and add them to the flask. The bung was fitted to the flask immediately after the potato pieces were added; making sure that it was airtight. This ensured that no oxygen produced during the reaction was lost which would alter the results.
The amount of oxygen is directly related to the rate of catalyse activity. The more oxygen, the
more catalyse activity and the less oxygen, the less catalyse activity. I will be able to measure
the oxygen using the measuring cylinder.
- The stop clock was then started. The flask was not agitated to increase the collisions between the Catalase and hydrogen peroxide molecules, and the clock was stopped when 1cm of oxygen had been produced in to plastic measuring tube, and the time was recorded. The stop clock was once again started and the time was read every time another cm of oxygen was produced.
- Once 9cm³ of oxygen had been produced, the bung was removed from the flask, and the flask was then washed out thoroughly so that no hydrogen peroxide was left behind which could alter the results of the experiment when different substances are being tested.
Below is my Table of results; it shows the time that it took for each 1cm of oxygen to be produced at a temperature of 27°C.
Table A: Preliminary Experiment
As can be seen from this Table, the length of time it took for oxygen to be produced increased as the experiment progressed, and that the Catalase breaks down the most of the hydrogen peroxide at the beginning of the experiment, showing that the Catalase enzyme is very fast acting.
My preliminary experiment was not very reliable though, and because I only had time to record one set of results, which meant I couldn’t produce a graph, an average or even another set of data to compare my hypothesis to.
My preliminary experiment wasn't a complete failure though; I did find out something that I didn’t know. It was that the lengths of time it took for the Catalase to react with the hydrogen peroxide, and produce oxygen or every 1cm increased as time went on.
I also found that my experiment was set out well, I needed no extra equipment, and that the only improvement I need to make to my final set of experiments is to decrease the number of readings I take, and slightly alter the way in which I take them. In my preliminary experiment I took the reading of the time after every 1cm³ of oxygen was produced. In my main experiment I will be taking the readings at the end after 30cm³ of oxygen is produced.
Main method
I will use the same equipment (see list from preliminary experiment) and a similar method for my main experiment as I did for my preliminary experiment, but with the following changes:
- I will take down the readings differently. This will be to let the clock run until 30cm³ of oxygen has been produced, and take down the total amount of seconds produced at the end, rather than every cm produced as I did in my preliminary experiment.
- I will keep the following variables the same:
- 3 pieces of potato
- Each weighing 2gms
-
Volume of the 2H2O2 will be 25cm³
-
Concentration of 2H2O2 will be 20V
-
Ph of the 2H2O2 will be 8 (alkaline)
- Volume of water in the measuring cylinder will be 100.0ml
- Room temperature is 25ºC approximately
If any of these variables were altered, it would not be a fair test!!
- I will take change the temperature of the hydrogen peroxide 5 different times, and repeat
each experiment 3 times to obtain an average. I will use the temperatures 10°C, 20°C, 30°C,
40°C, and 50°C to get varied results.
- Instead of using a measuring tube to measure 25cm³ of hydrogen peroxide, I will be using a syringe or pipette because it will be more accurate.
- At the beginning and at the end of the experiment we will be monitoring the temperature of the room. A temperature change may have an affect on the experiment.
- I may decide insulate the surface of the flask to keep in the heat, so that the results are more accurate. If I do not insulate the flask then I must take into consideration that the results will not be as accurate as they could be due to temperature loss as the experiment progresses.
I will make the following other measurements accurate by:
- Using a pipette to measuring the hydrogen peroxide
- Using two thermometers to monitor the temperatures of the room and in the flask
- Using a measuring beaker to keep the same amount of water in each experiment
- Using a plastic measuring cylinder (cm units) to measure the oxygen being produced
- Use indicator paper to test the Ph of the hydrogen peroxide
Skill O – Obtaining the Evidence (8 marks)
Table Of Results
Table Of Averages + Q10 Results
- The time taken for the reaction to produce 3cm³ of oxygen was noted in seconds.
- The rate of reaction was then calculated by dividing 1000 by the time taken. (The rate of reaction is expressed as “S-1.”)
- The Q10 rule which states “ The rate of reaction should double for each 10°C temperature increase (Q10=2) until optimum temperature is reached” was then worked out using this formula:
Q10 = Average time taken to produce 30cm³ of O2 at 10°C above a certain temperature
Average time taken to produce 30cm³ of O2 at a certain temperature
While collecting this data the following safety precautions were taken:
- Goggles were through the whole experiment, especially around the hydrogen peroxide
- We were cautious of the hydrogen peroxide leaking onto our skin, and avoided any direct contact with the liquid.
- All apparatus was kept away from the desk edges to avoid any spillages or breakages.
- All lids to the hydrogen peroxide were replaced directly after use to avoid spillage.
Skill A – Analysing the Evidence (8 marks)
Looking back over my results I found out that at low temperatures the time taken to produce 30cm³ of oxygen was a lot longer than at higher temperatures. In my prediction I put the optimum temperatures as being about 40°C, but in my results table, and shown on my graph it was in fact about 25-30°C. This surprised me because enzymes are used to working in the body inside the stomach, which is about 30°C.
Looking at (graph 2) I can see that the gradient is quite steady at the beginning, and gradually gets flatter as the temperature rises, showing that the time taken to produce the 30cm³ of oxygen is getting shorter. When it reaches it’s optimum level, the temperature steadily starts to increase until it reaches 40°C, where at this point the gradient becomes very steep, and the time increases the most in the shortest period. This is when the denaturing occurs.
Looking at my background knowledge and prior experiments using enzymes I can explain my results as follows.
Kinetic theory states that particles, which gain heat energy, move more quickly. In our case the reacting particles are the substrate (hydrogen peroxide) and the enzyme Catalase. As the temperature is increased the particles of hydrogen peroxide have more energy therefore they collide with the potato more frequently and so increasing the rate at which the product is formed.
When optimum temperature is reached, the collisions are at their fastest, and the molecules have the most kinetic energy, causing the most oxygen to be produced. However at a certain temperature this is no longer the case. This is because enzymes are proteins and proteins can be denatured at high temperatures. This is because proteins have a 3D shape. In our case the Catalase has a certain shape that the substrate fits into. At high temperatures the active site on the enzyme is altered, see diagram below.
(Diagram showing active site on the enzyme is altered therefore stopping products being formed)
Skill E - Evaluation of evidence
In my experiment I made sure that all of my materials were measured accurately, using scales for the potatoes, measuring equipment for the liquids, and a stop clock to measure the time.
In my method, keeping the temperature constant throughout the investigation was the hardest factor to maintain, as the temperature of the hydrogen peroxide would change quite quickly and therefore it wouldn’t be at the temperature required long enough to complete the experiment. To overcome this problem I could keep the flask containing the hydrogen peroxide in a hot water bath for all the temperatures making sure that the water bath was the suitable depth. This would ensure constant temperature throughout the whole experiment.
Looking back at my results I found some anomalous results in my findings. When averaging I used these results, which could of made the average either lower or higher than it should be. To improve this I should have missed these results. Not including some sets of results when making averages may have led to better values.
My results are in line with those I predicted. Graphs indicate rise in temperature up a point leads to an increase in oxygen production. This is in line with kinetic theory. However it is very clear that after a certain temperature is reached the enzyme actually virtually stops. This supports my theory of lock and key fit.
However optimum activity of enzyme is at about 37ºC this is as we expected. But at 50ºC the enzyme is still not denatured according to my results. This is a higher temperature than I would expect. Possible not allowing solutions to reach temperatures selected has led to an inaccuracy. It may be that in fact that many temperatures of solutions were lower than we stated.
Overall, due to reliable repeats and in general predictions being confirmed I feel my results are reliable enough to make a conclusion.
The obvious thing I would improve about the measurements I made would be to increase the range of temperatures used, maybe have gone up to about 60°C. In this way it may be clearer at the temperature which denaturing took place, and would possibly give a graph that resembled the graph in background knowledge.
Another way of improving this investigation is to change the method. I measured the time taken to produce 30cm³ of oxygen, when I could have measured volume of oxygen that was produced.