The graph from this experiment was almost perfect with a line of best fit that showed exactly what I was expecting, in that there was a direct relationship between light and the rate of photosynthesis until a certain point where it started to level off. This proved that my method was good and I had kept all the other variable under control and that this was a suitable plan to use for my main experiment.
Plan:
Variables - To keep my experiment a fair one, I will keep all the other factors that affect photosynthesis the same, except light which I am investigating.
I will keep the carbon dioxide level the same for each measurement by using the same amount of Sodium Hydrogen Carbonate which produces excess carbon dioxide for the plants use in photosynthesis. I am keeping this the same because carbon dioxide is a limiting factor for the rate of photosynthesis, so the more carbon dioxide is available, the more will react in a certain amount of time and the more oxygen will be produced.
I will keep the temperature of the reaction the same by using a thermometer to check the temperature and changing the water for each separate measurement and getting the water from the same source so the starting temperature is always the same. I will do this because if the higher the temperature, the closer the enzymes will be to working at their optimum rate, and because the enzymes are used in the reactions, the reactions will occur faster and so more photosynthesis will happen in the time and more oxygen will be produced. I will make sure that the temperature does not exceed 38°C because this will mean that the plant’s enzymes will be denatured and no photosynthesis (or very little) will be able to take place.
I will keep the amount of water the same by using a measuring cylinder to measure the same amount of water into the beaker for each measurement. I will do this because if the amount of water is increased the guard cells will become turgid and the stomata will open to absorb water by osmosis and so affecting the carbon dioxide uptake (more carbon dioxide taken in) and as I have already explained, the amount of carbon dioxide available directly affects the rate of photosynthesis.
Guillaume Wright 10C2 GCSE Science Coursework
C/W Collecting Oxygen gas during Photosynthesis - How does light intensity 29/4/01
affect the rate of photosynthesis
I will keep the amount of time that I let the oxygen collect in the delivery tube the same by using a stopwatch to time 5 minutes from the start of each measurement and take the funnel away from the plant immediately after the time period has elapsed. I will do this because if the time is increased, more reactions will take place and therefore more oxygen will be produced as a result of the increased amount of photosynthesis taking place. This is not a direct variable of the rate of photosynthesis, just the amount of photosynthesis that takes place.
I will need to keep the amount of chlorophyll the same for each measurement by using the same piece of Pondweed for each measurement. I will do this because the more chlorophyll there is, the more reactions can take place and the faster the rate of photosynthesis will be and so more oxygen will be produced.
I will keep the same light wavelength (colour) of the light by using the same lamp and checking before each measurement that the light has not been changed. I will do this because the leaf is green and so it reflects this wavelength of light and does not absorb it so no photosynthesis would take place with green light. Different chemicals also use different wavelengths of light so it would alter the speed and amount of reactions taking place, altering the rate of photosynthesis.
I will keep the source of water the same for each measurement by using the same tap so that I gain the same type of water. I will do this because varying the water may vary any life in the water (I found visible animal life in my preliminary experiment) or any nutrients found in it. Any life found may use some of the oxygen produced for aerobic respiration (and will also produce extra carbon dioxide as a result) so I will collect less oxygen in the delivery tube and nutrients also affect the reactions in the plant and so will affect the rate of photosynthesis.
I will keep the surface area of the plant the same by using the same piece of Canadian Pondweed for each measurement. I will do this because the larger the surface area is or the more leaves there are, the more light rays are likely to hit it and therefore there will be more light entering into the plant and increasing the rate of reactions in the plant and therefore increasing the rate of photosynthesis.
Although I am investigating the rate of photosynthesis, I am looking at the distance of the light source from the plant and so I must keep the power of the lamp the same by using the same power supply (mains) because this will mean a higher light intensity with more electrical energy transferred as light energy by the plant and more light to use in the reactions and a faster rate of photosynthesis.
I will also keep other, smaller things such as the same equipment e.g. stopwatch and beaker so that I can gain more reliable results.
Safety: To keep safe in this experiment I will take care with the electrical equipment and with the small knife. I will also carefully handle any chemicals such as the Sodium Hydrogen Carbonate and clear up any spills.
Method: First I will get out all the equipment that I need for this experiment and assemble it as shown in the diagram. I will then measure out 750ml of water using a measuring cylinder and put it into a beaker (clean so that the maximum amount of light can enter the beaker) under the water so I can collect all the gas given off into the water. I will then take a piece of Canadian Pondweed and use a knife to make a small diagonal slit at the top of the plant so that I can gain the maximum oxygen that it produces. I will then put the piece of Pondweed in the beaker, with the slit end pointing up underneath the filter funnel so that I can collect all the gas given off by the plant. I will then use a spatula to measure out two spatulas of Sodium Hydrogen Carbonate and put it into the beaker and let it dissolve in the water for two minutes and I will also set up a lamp 500mm away from the plant using a ruler and lining the lamp up
Guillaume Wright 10C2 GCSE Science Coursework
C/W Collecting Oxygen gas during Photosynthesis - How does light intensity 29/4/01
affect the rate of photosynthesis
with the beaker and connect it to the mains supply and switch it on while the chemicals are dissolving in the water so the plant will begin to photosynthesise. While this is happening I will put a filter funnel over the piece of Pondweed and put a delivery tube on the end of the filter funnel and then attach a syringe to the end of the delivery tube. I will then hold the delivery tube and the syringe up with a clamp stand to hold it still. I will then use the syringe to draw up the water from
the beaker to fill the delivery tube and make sure that no air bubbles are present that may change the size of the bubble produced by the plant. I will then refill the beaker up to 750ml for each measurement. I will have taken the filter funnel out of the water while I do this to stop the oxygen released by photosynthesis in the two minutes reaching the delivery tube. I will then make sure that the lamp is 500mm away with an accurate ruler and put the filter funnel back in and time with a stopwatch for five minutes. After five minutes I will take the funnel out and use the syringe to draw the bubble up and use the scale on the side of the delivery tube to read off the length of the bubble.
I will then replace the water and start the whole experiment again using the same method but moving the lamp forward 50mm and turning it on again and leaving it for five minutes and record the results again. I will then repeat this 8 more times, bringing the lamp 50mm closer each time and recording the results. I will also do the whole experiment twice again and draw up an average table for each of the ten different measurements and use this to draw a graph of my results and enable me to draw a line of best fit for my results. To gain more reliable results I will use another syringe to push an air bubble of a certain size (using the scale on the syringe) into the delivery tube and check it’s length so that I can gain a ratio of length to volume of bubble so that I can convert the length of each bubble into a volume measurement for more reliable results. From this system I worked out that 150mm in the tube was 5mm^3 of water.
An alternative to this would be to work out the diameter of the delivery tube and use the equation for a cylinder to work out the volume of the bubble (diameter of tube is 1mm so the equation is; (0.25*π)*length.
List of Apparatus:
- Beaker
- Measuring cylinder
- Spatula
- Stopwatch
- Lamp
- Clamp Stand and clamp
- Filter funnel
- 2x Syringe
- Delivery tube
- Piece of Canadian Pondweed
- Ruler
- Power source (mains i.e. plug)
- Sodium Hydrogen Carbonate (NaHCO )
- Thermometer (if necessary)
- Small knife
- Water
Guillaume Wright 10C2 GCSE Science Coursework
C/W Collecting Oxygen gas during Photosynthesis - How does light intensity 29/4/01
affect the rate of photosynthesis
Diagram:
Measuring cylinder Stopwatch Syringe Delivery tube Clamp Stand
Oxygen bubble
Clamp
Lamp Light rays Filter Funnel Oxygen
Beaker Pondweed
To power supply
Water
Ruler
Results:
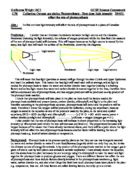
Conclusion: From my results and graph I can conclude that the general trend of the data that I collected from my experiment shows that as light intensity increases around a plant, the rate of photosynthesis that occurs in that plant increases. This happened because less light rays reached the surface of the plant as it got further away and so less light (particles or waves) was received by each cell in the plant on average. Light is needed so that the water and carbon dioxide can react together (making it a limiting factor), and so the less light there is present the less water and carbon dioxide is reacted together in a certain amount of time which means that less photosynthesis will take place and less oxygen is produced (a lower rate of photosynthesis). I can also tell from the general shape of the data and from my line of best fit that the rate of photosynthesis increases in proportion to the light intensity (shown by the straight, negatively sloping part of the line) until a certain level (approximately 500mm) where the line starts to curve and straighten out, which shows that the rate of photosynthesis begins to drop and is affected less by light intensity. This happens because when the a certain light intensity is reached as you increase the light intensity, it begins to lose it’s affect on the plant’s rate of photosynthesis as there is another limiting factor e.g. lack of water or carbon dioxide that is affecting the plant and is in short
Guillaume Wright 10C2 GCSE Science Coursework
C/W Collecting Oxygen gas during Photosynthesis - How does light intensity 29/4/01
affect the rate of photosynthesis
supply so that however much light the plant has it cannot photosynthesise due to the lack of another factor.
I can conclude that oxygen was made because photosynthesis would have taken place in the plant as all the factors needed were available to the plant at the start and therefore using the photosynthesis equation in my prediction I can say that all of the compounds on the other side of the equation were made by the plant and that one of these is oxygen and therefore the bubbles of gas that I saw in the water must have been oxygen.
Evaluation: My experiment went well in general and once I had settled on a suitable method everything went according to plan. As I started my experiment with the above mentioned method, I found it difficult to create the proper situation where I could carry out a fair and effective experiment and record my results accurately. There were air bubbles in the delivery tube that would affect the bubble that was made and the apparatus was very awkward to put together and maintain. I decided that I would use an alternative method to collect the oxygen. I considered collecting the oxygen in a boiling tube but decided that this would be difficult to measure. Both of these two methods were the most accurate but I had to revert back to counting the bubbles that were released by the pondweed instead as this was more straightforward and needed less time. I had changed my original plan and decided to do 10 different measurements for each experiment and repeat them 3 times to make my results and my average table more reliable. I found that I did not have enough time, even with the new method to collect 30 results, so I only did the experiment twice and thus my results are less reliable. I also changed the distance movement by taking the lamp forward 100mm instead of 50mm each time to accommodate the new range of measurements that I wanted to do. I thought this would represent the experiment more effectively and fairly to have a larger range instead of dense results. My original idea that I could measure the ratio of the length and volume of a bubble for an accurate measure of the volume of gas given off proved difficult because of the air bubbles and so I measured the diameter of the delivery tube to give me a formula where I could work out the volume of the bubble. If I had been able to keep with my original plan I would have used this method of measurement, although it is less accurate than my original idea. This experiment is difficult to evaluate as the problems need solutions, but the solutions cause problems in turn.
Due to this inaccurate way of measuring the oxygen given off from the plant, there were a couple of anomalous results that did not follow the general trend. One result even showed that the rate of photosynthesis was decreasing as light intensity increased (100mm result). This partly occurred due to the levelling out of the line of best fit that I explained earlier in my conclusion and could also have occurred because the bubbles that were given off were large and so less of them were given off to account for the same volume of gas or more gas as the previous result (200mm). This would also explain the 600mm result being anomalous and shows that collecting bubbles of gas for this experiment is an inaccurate way of measuring the rate of photosynthesis.
There are many improvements that I could make to my experiment to make the results more reliable for my conclusion. I could have used more dense results, if I had the time, so the line of best fit could have been drawn more reliably. I could have also repeated the experiment 3 more times to make my average results table much more reliable. I could also repeat the anomalous results again to get a better average for these distances and a more reliable line of best fit. I could have tried to take out the air bubbles in the delivery tube so that I could use my original method that would have probably been more reliable and more effective. I also did not wait for the plant to begin to photosynthesise (2 minutes) and so this could have meant that the true rate of photosynthesis was not recorded, as the plant did not
Guillaume Wright 10C2 GCSE Science Coursework
C/W Collecting Oxygen gas during Photosynthesis - How does light intensity 29/4/01
affect the rate of photosynthesis
photosynthesise in those first couple of minutes. There is also the problem of heat because as the light intensity increases in this experiment, so does the amount of thermal energy received by the plant’s
surface in much the same way as the light rays shown in my prediction diagram. This would mean that temperature would not remain constant and could affect the readings. An improvement would be to use a transparent insulating material between the lamp and the plant so the heat remains constant. I could also use a bunsen burner to keep the water temperature constant for each measurement. I could also wait for the lamp to cool down after each measurement to minimise the temperature difference in measurements. I could also let the beaker cool off from each measurement for the same reason. An idea to make my graph more presentable and easier to interpret I could use the volume of gas given off and I could also use light intensity instead of distance by using a dimmer switch or a power pack to change the voltage being given to the lamp. This would be a more accurate way of changing the light intensity and a more reliable way of measuring it. Using my results I could use a formula to convert distance into light intensity although this would only make my graph clearer rather than my results more reliable.
I could also use a set of scales to measure the exact amount of Sodium Hydrogen Carbonate going into each test tube so that each time, the plant has the same amount of carbon dioxide (limiting factor). Considering that I noticed a living animal in the test tube in one of my measurements, I can say that some of the oxygen was used up by living creatures in the water and this can vary for each measurement and so can lead to unreliable results. A solution to this would be to boil the water before each measurement to kill all the animals so no gas is used by animals for respiration. As the time increases in the space of the 5 minutes that I let the plant photosynthesise for, a limiting factor may start to affect it e.g. level of carbon dioxide and so the results for each measurement may be more similar than they actually are as the rate of photosynthesis may decrease due to the lack of another limiting factor. Therefore, for another improvement I would only do the reading for 2 minutes instead so the rate of photosynthesis stays level.
There are also more limiting factors that could have affected the accuracy of my experiment. Some of the oxygen produced by the plant is used in respiration not only by animals but by the plant itself so I would not have known the true amount given off. This would also apply to the fact that some of the oxygen would have been dissolved in the water. There were also other experiment in the classroom and my piece of pondweed could have gained extra and varying amounts of light from this. As the light was moved further away the light intensity would have been less accurate and so enhances my suggestion of the use of a dimmer switch. As I mentioned the solution to some of the problems was to change the piece of pondweed e.g. because it’s rate of photosynthesis decreased over time, it would have heated up etc, but this in turn would cause a problem as it would vary the surface area of the plant and the amount of chlorophyll in the plant’s cells (both factors).
For extension of my experiment I would have combined this plant with other different types and created an average table from lots of varying sources to create a much more reliable overall picture of whether light intensity affects the rate of photosynthesis. I could have extended the range on the distance axis so that I could find out how this pattern evolves at the extremes of the axis and also do sections of the range in more detail e.g. more dense results every 1mm at the small end of the axis to see a more reliable pattern. I could then conclude each part of the line of best fit in more detail and explain the different stages of the experiment. I could have looked at all the other limiting factors, maybe in the same experiment so I could see the separate relationships and conclude which factor affects photosynthesis more. Finally I could investigate the precise mathematical relationship between these two factors using an equation of the line of best fit and a Spearman’s Rank calculation.