Preliminary work
Initially, to ascertain a suitable range of distances at which to record results for my experiment, I did a preliminary investigation in which I recorded the number of bubbles of oxygen given off in a given time at various light intensities. To alter the light intensity, I placed a lamp at various distances from the plant. I also therefore needed a way of accurately measuring the light intensity, and I did this using a light meter. I recorded the lux reading (unit of light intensity) at each distance. I got the following results:
Method
Input variables – light intensity is to be varied by increasing and decreasing the distance from the light source to the plant
Output variables – volume of oxygen produced (rate of photosynthesis) is to be measured by finding the volume of oxygen produced in a minute, and thus finding the rate of photosynthesis
Control variables –
Light wavelength (colour) – light the pigment, chlorophyll, in the leaf, absorbs energy. Chlorophyll easily absorbs blue light, in the 400-450 nm range, and easily absorbs red light, in the 650-700 nm range. However, it does not easily absorb green or yellow light, rather it reflects them, decreasing the amount of light absorbed, and therefore the rate of photosynthesis. This can easily be controlled, simply by using the same lamp throughout the experiment.
Carbon dioxide concentration – This can affect the rate of photosynthesis, since if there is too little CO2, it can become the limiting factor, thus impeding the viability of the experiment. In this case, as long as the experiment is done over a short period of time, the amount of carbon dioxide used up by the plant will not be sufficient enough to cause the carbon dioxide concentration to become the limiting factor. But I am going to add a fixed amount of Sodium hydrogen carbonate to the water, thus ensuring a large enough supply of carbon dioxide should this be a problem
Water availability – water is also required in the photosynthesis reaction, and when it is lacking, the plants´ stomata close to prevent further water loss. This closing of the stomata cells also leads to little carbon dioxide being able to diffuse through.
Clearly, in a water plant, like the pondweed, as long as the plant is fully submerged in water at all times, this will not be a problem.
Temperature – Enzymes are used in the photosynthesis reactions of a plant. Therefore, temperature will increase the rate of photosynthesis, until a point at which the enzymes denature. Although performing the experiment at a temperature slightly higher than room temperature, perhaps 25ºC, would have a positive effect on the accuracy of the readings I took, as it would reduce the percentage error, by increasing the volumes, I decided that the inaccuracy of maintaining a constant temperature would outweigh any advantages. I am therefore going to perform the experiment at room temperature, checking the temperature frequently, in case the heat given off from the light should slightly raise the temperature, in which case I shall simply refill the beaker with more water after each experiment.
Apparatus List
- Canadian Pondweed (Elodea)
- Beaker
- Boiling Tube
- Light Meter
- Bench Lamp
- Meter Stick
- Water
- Sodium hydro carbonate
- Stopwatch
- Spatula
- Glass Funnel
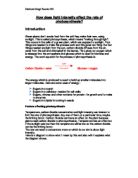
- Place 500ml of H O into a beaker. Add 1 spatula of Sodium Hydro Carbonate to the H O.
- Set up the boiling tube, glass funnel, and Elodea as shown in diagram.
- Set up bench lamp with the cover on and position 10cm from beaker.
- Turn on the lamp and start the stopwatch. Count the number of bubbles produced in 2 minutes.
- Record the data in the results table, including the light intensity (in lux)
- Repeat process with light meter at 20cm, 30cm, 40cm etc.
- Repeat to 100cm and the repeat whole experiment another two times. Record all data collected in the table.
Fair Test
- Use the same Elodea
- Keep the CO levels constant
- Ensure that the bench lamp is the only light source
- Use the same lamp and bulb throughout
- Use the same amount of H O
Safety
- Keep other away from the experiment
- Keep the experiment away from the edge of the table
- Clear up spilt water
Results
Temperature=70°F
Analysis
My graph was in the form of a best-fit curve. I drew it as a curve rather than a straight line because of the clear pattern of the points. This meant that the rate of photosynthesis increased as the light intensity increased. This was because photosynthesis is a reaction, which needs energy from light to work, so as the amount of energy available from light increased with the rise in light intensity, so did the amount of oxygen produced as a product of photosynthesis. My graphs showed that the relationship between the light intensity and the rate of photosynthesis was non-linear, as the graph produced a best-fit curve. However, it does appear that for the very first part of the graph, the increase in rate is in fact proportional to the increase in light intensity (i.e. a straight line). From these results, I am able to say that an increase in light intensity does certainly increase the rate of photosynthesis. The gradual decrease in the rate of increase of the rate of photosynthesis (the shallowing of the curve) can be attributed to the other factors limiting the rate of photosynthesis. As light intensity increases, the photosynthetic rate is being limited by certain factors, such as carbon dioxide and temperature. These factors do not immediately limit the rate of photosynthesis, but rather gradually. As light intensity increases further, so the rate of photosynthesis is being limited by other factors more and more, until the rate of photosynthesis is constant, and so is almost certainly limited in full by another factor. Overall, both graphs and my results support my predictions fully. My idea that the rate of photosynthesis would increase with light intensity was comprehensively backed up by my results. This is because a higher light intensity involves a greater level of light energy.
Evaluation
Although I feel that my experiment was sound overall, I thought there were many points at which the accuracy was not perfect. As I have already stated, my preliminary experiment was not accurate enough to justify being used as my main experiment, and also did not have enough readings, however many of the smaller inaccuracies also apply to my main experiment. Firstly, the distance between the light sources and the Canadian Pondweed were not measured to a very high degree of accuracy, especially when you note the fact that the distance should have been measured exactly from the filament of the light bulb to the centre of the plant, and it is possible here to find a percentage error. I estimate that the error could have been up to 0.5cm. Although I was not actually using the distances as part of my results, I used them as a marker for where the lamp was placed each time, as I assumed that the light intensity would be the same each time at a particular distance. Therefore, any inaccuracies in measuring the distances, i.e. if a distance was slightly different when doing the actual experiment from the distance at which I earlier measured the light intensity, an error would ensue.
The second major inaccuracy was due to background light in the vicinity. We tried to reduce this error by closing all blinds in the laboratory, but due to practical reasons, we could not all perform the experiment in a separate room, and we therefore experienced light pollution from other student’s experiments. This would have had a very marginal effect on my results as a whole, but to eliminate this problem, it would have been necessary to perform the experiment in a totally dark room.
A further inaccuracy was in the heat generated by the lamp. As I have earlier described, temperature has a very noticeable effect on the rate of photosynthesis, and so any increase in the temperature of the pond water would have had serious effects on the accuracy of my results. To ensure this did not happen, I monitored the temperature of the water before and after every reading, to check that the temperature did in fact not rise. It turned out not to be a problem, as over the short period of time taken by my experimental readings, the temperature did not rise at all. However, if I were to extend the time of my experiment to 5 minutes for each reading for example, which would have the effect of reducing other percentage errors, I would have to find some way of keeping the temperature constant. One way of doing this would be to place a Perspex block between the lamp and the plant, which would absorb most of the heat, while allowing the light energy to pass through.
As I mentioned in my planning, carbon dioxide concentration could have been an error in the experiment, however, I feel that due to the short period of time taken, there is very little chance that the concentration would ever have been so low as to have become the limiting factor.
The last inaccuracy, though a small one, was in the time keeping. The main problem here was in when to begin the two minutes. If for one reading, the two minutes was started just after one bubble had been produced, and in another reading it was just before, this could have had a negative effect on the accuracy of my results. I therefore ensured that in each case I started the stopwatch just after a bubble had been produced, thus heightening the accuracy. Improvements could have been made as I have stated, mainly by simply increasing the time taken. However, due to practical time constraints in taking the readings for my investigation, and some consequential problems relating to time extension, I could not in fact make these adjustments. To extend my enquiries into the rate of photosynthesis, I could perhaps try to link in some of the other limiting factors to the same experiment, as well as investigating them in their own right. It could also be interesting to explore the effects of coloured lights on the rate of photosynthesis, which could lead to the question of whether or not other types of light, such as fluorescent lights or halogen lights, would have a different effect on the rate of photosynthesis.