We will measure the wavespeeds in water depths ranging from 1cm to 8cm, including 0.5cm. Every time we drop the tray, it will be dropped from a height of 5cm. The length the wave will travel will be 35cm. Each water depth will be repeated four times to help make the results more reliable. This should give me a wide enough range of results to draw a conclusion from. To make the experiment safe we shall be careful with the water to prevent accidents. Also, we will be careful when dropping the tray so that we don’t drop it on someone’s fingers.
I predict that as the depth of the water increases, the wavespeed will also increase. I think this will happen because of what I know happens at a beach. Close to the beach, the waves move very slowly; the wavespeed is slow. The water depth close to the beach is low. As you move further away from the beach, the faster the waves move; the wave speed is faster. The water depth increases as you move away from the beach. It is from this fact that I have based my prediction on.
Results.
These are my results. I feel I have measured enough to draw a conclusion from.
Conclusion.
My results do show that as the water depth increases, the wavespeed also increases. There isn’t a definite pattern, the speeds just increase. The possible reason for there not being a more definite pattern is experimental error.
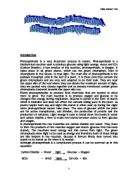
The reason that the wavespeed increases when the water depth is increased is that as the water depth increases, the friction, slowing the wavespeed, decreases. The following diagram will help to explain:
In the sea or in a lake, the water depth increases as the bed becomes lower, which you can see in the diagram. There is friction between the bed and the wave. This friction slows the wave down, making the wavespeed lower. As the bed becomes lower, the friction is reduced between the bed and the wave, so the wavespeed increases.
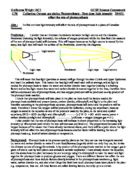
On the following page, there is a graph showing how water depth affects wavespeed. The graph does show the relationship between water depth and wavespeed and that as the water depth increases so does the wavespeed. The line of best runs through most of the points. The pattern shown by the graph is that if the water is shallow, then increasing the water depth by 1cm has a big affect on the wavespeed. For example, the average wavespeed for the water depth 1cm is 0.30m/s. If we increase the water depth by 1cm to 2cm the average wavespeed increases to 0.41m/s, which is a big increase. However, as the water depth gets deeper, the increase in wavespeed is not as big as it is in shallower water. For example, the average wavespeed for the water depth 7cm is 0.78m/s. If we increase the water depth by 1cm to 8cm, the average wavespeed only increases to 0.82m/s. As you can see, the wavespeed in deeper water does not increase as much as it does in shallow water.
This means that the curve on the graph begins to flatten out as the water depth continues to increase. Eventually, it will completely flatten out because there will be a water depth at which the wavespeed reaches its maximum speed and after that it will no longer increase. To explain this, I need to use the diagram above. As you can see from the diagram, once the bed goes down to a certain level, the wave only has friction between itself and the water. The friction between water and wave (which is like friction between water and water) is not as great as the friction between the wave and the bed. Once the friction is only between the water and wave, it can no longer increase because, although the water depth continues increasing, the amount of friction stays the same. The diagram shows this. This is why the graph will eventually flatten out.
These results do support my prediction. My prediction was that as the water depth increased, so would the wavespeed. As you can see, this supports my results. The results clearly show that as the water depth increases so does the wavespeed. For example, the average wavespeed for the water depth 2cm is 0.41m/s. When the water depth was increased to 3cm, the average wavespeed increased to 0.61m/s. This shows my results support my prediction. If the results are plotted on a graph (see the next page) the line of best fit runs through most of the points, showing there is a strong relationship between the water depth and wavespeed. As the line goes up, it shows that as water depth increases, so does the wavespeed.
Evaluation.
I think that the method I chose to obtain evidence was reasonably successful. The results are very consistent and accurate. There are few anomalous results. The most anomalous result is the wavespeed for the water depth of 4cm. It doesn’t fit in with the other results. It is probably anomalous because of experimental error. It can be difficult to get the conditions identical for every time we carry out the experiment. As identical conditions are essential for 100% accurate results, there are bound to be results in my experiment that are not quite 100% accurate. Accuracy is good, but it is very difficult to be completely accurate.
The procedure was suitable and I was able to obtain the evidence I needed and was able to come to a conclusion from them. However if I carried out this investigation again, I would use a different method. I would count a certain amount of wave bounces, for example I could count 7 bounces. I would then time how long it took for the wave to bounce that amount of times. From that information, I would be able to work out the wavespeed. This method would produce more reliable results, as it is more controlled, and it would be simpler to conduct.
I think that my results are quite reliable. I think this because they all, more or less, fit into a pattern and the line of best fit on the graph runs through nearly all of the points. To make my results more reliable, I could also repeat the experiment more times. This would give even more reliable results as the more you repeat them, the more reliable they are. Also, I could make the measurement of water depth and the height of which the tray is dropped from more accurate. To do this I could work out the volume of water needed and then measured the water in a measuring cylinder. To measure the height of the tray, I could use a block of something like wood that was 5cm high. I would place it under the tray and then remove it when I was ready to start. This would ensure the tray got dropped from exactly the same height every time. Both of these improvements will make the evidence more accurate and more reliable.
The evidence is sufficient to support a firm conclusion. I have plenty of evidence to support the conclusion and the evidence is mostly accurate. I can tell the evidence is generally accurate because the line of best fit on the graph runs through most of the points.
To extend this investigation, I could investigate what happens with deeper water depths, to see if the wavespeed continues to increase or whether it has a maximum speed. I could investigate how changing the distance the wave has to travel affects the wavespeed. Also, I could investigate how changing the temperature of the water affects the wavespeed. These extra investigations would give me a much better conclusion, that had a lot more evidence to support it and that covered more factors that affect wavespeed.