In order to make the experiment a fair test, I shall try to keep all of the variables the same, except the concentration of the glucose solution. The cylinders will all be the same length, and diameter, to give an equal surface area; as different surface areas would cause osmosis to occur at different rates. The cylinders will also all be bored from the same potato, as others may have different glucose concentrations. The temperature will also need to be kept the same, as this will affect the rate of osmosis. This will occur as the increased heat energy provides more energy to the atoms in the cylinder, making the speed at which they vibrate increase; therefore, increasing the number of molecules moving across the semi-permeable membrane – increased rate of osmosis. The amount of solution used should also be kept the same throughout at 10ml.
As I alter the strength of the glucose solution, that is if cell sap contains glucose, I expect the mass of the potato pieces to change. When immersed in a glucose solution which is less concentrated than that inside it’s cells, water will move into the cells, making the potato piece turgid and increasing it’s mass. Likewise, when the piece of potato is immersed in a glucose solution with a higher concentration than it’s own, water will move out of the cells mostly, leaving the cells limp and decreasing it’s mass. I also predict that when immersed in a glucose solution with a similar concentration to it’s own, the water will move in and out of the cells in equilibrium, leaving the potato pieces with the same mass.
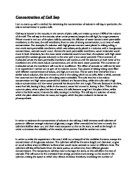
When the change in mass is plotted on a line graph, I predict that the graph will look like this.
The point where the line crosses the X-axis will show the concentration of the glucose solution the potato’s mass changed the least in, therefore, giving me the concentration of the glucose in the cell sap of the potato cells.
Method
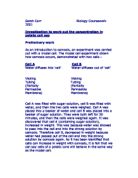
To begin with, I bored several cylinders out of the same potato, using a cork borer. Then, on a ceramic tile, I cut them into lengths of 3cm using a scalpel, and a ruler. In order to prevent the loss of moisture from these pieces whilst I set up the experiment, they were then placed in a covered petri dish.
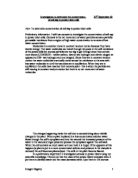
I then created my different strengths of glucose solution. I was provided with a 1M stock solution of glucose, which I had to dilute into 4 other strengths, to give me 5 solutions to test with. I used a 10ml-measuring cylinder to dilute the glucose solution. First, I put an amount of 1M glucose solution in the measuring cylinder, 8ml for 0.8M, 6ml for 0.6M, and 4ml for 0.4M. The cylinder was then filled up to the 10ml line with deionised water. 10ml of the 1M glucose solution was also measured in this way, as was 10ml of deionised water, to create a 0M solution. As each solution was created, the contents of the measuring cylinder was poured into a test tube, which was marked with a permanent pen, and arranged in ascending order in a test tube rack. Two sets of solutions, each with 6 different solutions, were created, so that two sets of results could be taken. The experiment set-up is shown below.
The potato cylinders were then weighed; they did not need to be measured, as they had been standardised during cutting to a length of 3cm. In order to find the mass of the 12 cylinders I was going to use, I used a balance, one that is highly accurate to 2 decimal places. Using this, I weighed each of the cylinders, recorded the reading, and then put the piece straight into the test tubes, recording which cylinder was placed in each tube. Once all of the cylinders were immersed, they were left for 25 minutes, in order for the osmosis to occur.
After the time has elapsed, I took each cylinder out of the tubes using long tweezers, in the order they were put in, to give each cylinder an equal amount of time immersed in the solution. They cylinders were each measured lengthways using a ruler, and had their mass measured, using the same electronic balance as used before. I ensured that I carefully blotted off any excess water from the surface of the cylinders using absorbent paper. This data was recorded.
The two sets of data, from the two experiments running concurrently, were averaged, to allow for any inaccuracies in each of the results. In order to plot a graph, and subsequently interpret the results, I needed to express the masses as a percentage change, from the original mass to the final mass. To do this, I used the following formula.
Percentage change = Final mass - Starting mass x 100
Starting mass
Using a computer spreadsheet, I entered both sets of results, and then worked out the percentage change in mass for all of the results. I then found the averages of both sets of results. This compensates for errors in either of the results. The results are shown below.
Results
The average percentage change of the cylinders’ mass was plotted onto a graph, as was the average difference in lengths. A line of best fit was then drawn on both of the graphs, and the point where the line crossed the X-axis was found.
By looking at the mass graph, I can see that my prediction was partially correct; as the concentration of the glucose solution increases, the final mass of the potato decreases.
The graph also showed that the points at the extreme left and right of the graph were distant from the line of best fit. This indicated that using a curved line could better join the points. When I did this, as seen on page , the curve that came out was s-shaped, which is not what I expected in my prediction, which was done thinking that the two factors, concentration and mass change, would be proportional to each other. By looking at where the line crosses the X-axis, we can find out that the concentration of glucose inside the cell was 0.54M, on the average straight-line graph, and 0.52M on the curved line graph. As I believe that the curved results show better what was actually happening, I shall say that the concentration of glucose in the cells of the potato was 0.52M
The graph that shows length gives the cell sap concentration to be 0.7M, which is quite different to that of mass. This can be discounted, as I did this not part of the actual experiment, but as a possible check to see if they two sets of data would tally, which they do, slightly, in that both decrease in length the higher the concentration of glucose they were immersed in. This difference between the mass change and length change might be explained by the fact that the cells, as they lose and gain liquid, can expand in all directions, not just the length that I am measuring in. Measuring the diameter as well, and calculating the average percentage change in volume of the cylinders may have rectified this.
The results can be explained using information that I wrote at the start of this coursework. When the potato was immersed in concentrations of glucose weaker that that contained inside of the potato, now shown to be 0.52M,which means that when immersed in concentrations of 0-0.52M, osmosis was occurring in and out of the potato cells, but there was more entering than leaving, causing the cells to take on more water, becoming heavier, therefore increasing the mass of the potato piece. When the potato piece was immersed in a glucose solution closest to that of the cell sap contained in it, osmosis took place, but as the two concentrations were the same, the water movement into the cell was the same as that entering, they were in equilibrium, so the mass stayed the same. I have shown this to happen at 0.52M. At concentrations higher than that contained inside the cells, found to be from 0.52M and upwards, more water left the cells than was entering it, so the greater rate of osmosis was leaving the cells.
The s-shaped curve shows that there was an initial high rate of osmosis, as the mass has increased the most, between O and 0.2M. Between 0.3M and 0.5M,there was a period of steadily decreasing osmosis, as the percentage change in mass decreased until around 0.5M, where the mass stayed the same. After 0.8M, the percentage change in mass seems to level off, so that it would show that this was the maximum that the mass would decrease by. One possible reason for this levelling out of the mass is that the cells can only take on a certain amount of water, or lose a certain amount. For example, at the concentrations below that inside the cells, and when water entered the cells, only a certain amount of water could enter as the cell wall would not be able to stretch and expand any further to accommodate any more water. Likewise, with the higher concentrations, where more water left the cells than entering, the cell may not have been able to contract to fit in with the lessened water, so the water stayed in. I cannot prove that this is the case, but it could be a plausible explanation. The readings did not extend at a molarity of higher that 1M, so I cannot say for sure whether it did level out or not. I would have to do more readings, say with potato pieces in solutions of glucose at 1.1, 1.2, 1.3, and 1.4M.
The prediction that I made at the start, before I carried out the experiment, was correct, in that it said that potato cells immersed in concentrations less than that inside of it would increase in mass, and those immersed in a higher concentration would decrease in mass. Although I did predict this, I did not predict that the graph that would result would be S-shaped, nor did I estimate the actual concentration.
My experiment could be improved upon in a number of ways. Further sets of results could be obtained, in order to increase the reliability of the results, and to eliminate the problem with the length not tallying with the concentration from the mass. The cell sap might not be solely a glucose solution, so further tests with different solutes, such as other sugars, might be more accurate. The actual concentrations of the glucose solutions were immersed in could be improved upon, by using a pipette to measure out the liquids instead of a measuring cylinder; there would be more accuracy. Measuring using a ruler was not as accurate as using a digital balance, as it required me to manually read the ruler, which opened up space for error.