I predict that if you add more potato cubes in then you are increasing the rate of reaction because there is more surface area. Which means more exposed particles for the catalse to break down. The sizes of potato are 1cm by 1cm which is 6cm2 the sizes we are doing are 6cm2, 12cm2, 18cm2, 24cm2, 30cm2. All these sizes were covered in 20cl of hydrogen peroxide.
Method
Firstly will get all of the equipment out. Then make sure all the tables are clear from bags and coats for safety reasons. Then will fill water bath, set up clamp and stand next to the water bath. Then I will take a 25ml measuring cylinder, fill with the hydrogen peroxide up to the 20-CL mark. Take a ruler cut the potato at 6cm2 on each one, that’s 1cm on each side and there are six sides. Place the potatoes in a side arm test tube, this side arm test tube will be covered in a paper towel. This is covered up with a paper towel, as the bottle is brown so hydrogen peroxide . Then get bungs and another 25cl measuring cylinder fill with water then tip up side down in water bath so the water is right to the top. The cylinder must be full each time to make it a fair test. Then put the hydrogen peroxide in the measuring cylinder place bung on to stop the 02 being lost. Then start the stop clock. I used 20 ml of hydrogen peroxide each time with a paper towel around every side arm test tube. I Will time each test for six minutes . the first test will be with 1 potao cube in with 20 cl of hydrogen peroxide this one test will be repeated 3 times the all the other test will have all same conditions exept more potato cubes (more surface area) . all the results I found were put into a table the transferred on this work the results are shown below.
Results from experiment
1 potato cube
2 potato cubes
3 potato cubes
4 potato cubes
5 potato cubes
Table of results
Graph for these results are labeled graph 3
Graph 1 preliminary testing 1 potato cube 6cm2
Graph 2 preliminary testing 5 potato cube 30cm2
Graph 3 (final graph averages)
Graph 3 (Bar graph for final results averages)
Analysis and knowledge
From graph 1 you can see that the result were accurate as the line of 02 produced is almost directly proportional. This shows that the longer you leave the experiment going for the more o2 produced this was obvious. But I had to find out if it was true that if you increase the surface area by putting more potato cubes in the hydrogen peroxide would increase the rate of 02 produced or the amount of 02 produced in the set time of 6 mins. Here is another graph (graph 2) this had five times more surface area. The graph shows that there is more o2 produced.
The final graph shows the averages from my results. I have worked out the average by adding all the results up result then dividing them by three. The averages are shown in the table above labeled averages table. The graph (graph 3) shows that if you are increasing the surface area then you are increasing the amount of o2 produced. This is because there is more exposed potato particles. The more exposed particle the quicker the reaction as the hydrogen peroxide particle can break down them easier. An example of this would be your digestive system the reason of you chewing your food is to break down the food particles in your mouth then the pancreas produces the enzymes to break down further.
Enzymes are biological catalysts made up from protein. As we know, catalysts are substances that speed up the rate of a reaction without itself being used up.
An enzyme has an active site, which has a unique shape into which only a substrate of the exact same unique shape can fit. Enzymes can be denatured at certain conditions. These conditions are high temperatures usually 37 c and extreme levels of pH. The bonds that hold enzymes together are quite weak and so are easily broken by the above conditions. When these bonds are broken the enzyme, along with the active site, is deformed, which means deactivating the enzyme. This is know as a denatured enzyme. Hydrogen peroxide will breakdown to oxygen and when Catalase is added. The reaction will increase with increasing enzyme concentration when molecules of hydrogen peroxide are freely available. However, when molecules of the substrate are in short supply, the increase in rate of reaction is limited and will have little effect.
Factors of rate of reaction
-
Concentration – When there is an excess of enzyme molecules, an increase in the substrate concentration, produces a corresponding increase in the rate of reaction. If there are sufficient substrate molecules to occupy all of the enzymes’ active sites, the rate of reaction is unaffected by further increases in substrate concentration as the enzymes are unable to break down the greater quantity of substrate.
-
Temperature – As temperature increases, molecules move faster (kinetic). In an enzyme catalysed reaction, such as the decomposition of hydrogen peroxide, this increases the rate at which the enzyme and substrate molecules meet and therefore the rate at which the products are formed. As the temperature continues to rise, however, the hydrogen and ionic bonds, which hold the enzyme molecules in shape, are broken. If the molecular structure is broken, the enzyme stops to function, as the active site no longer accommodates the substance. The enzyme is denatured. If the temperature is too high then the enzyme will denature but if the temperature is to low then the rate of reaction will be very very slow the. optimum temperature for an enzyme Is usually 37c any more then it will denature
Safety and fair testing
Whilst using the razor blades, care was also taken to hold them by the handle and not the blade to prevent an accident occurring.
As a precaution, I have tried to not touch the side arm test tube as my body heat will raise the temperature, increasing the rate of reaction. Any that will also make the particle move more when they should. I tried to stop people from banging into the desk to prevent this
Always wear safety goggles to protect the eyes from the hydrogen peroxide. Keep all apparatus away from the edge of the desk to prevent breakages. Do not run around or rush about.
I think that my experiment went fairly well but as I predicted that the incresing of surface area would increase the rate of reaction. This was clearly shown by7 the results tables I made. If I would have had more time then I would have made more results and made more averages to make the experiment more accurate
Equipment used:
- Side arm test tube
- 2 x 25cl measuring cylinder
- water bath
- stand and clamp
- stop clock
- hydrogen peroxide
- paper towels
- potato
- cutting tile
- scalp knife
- ruler
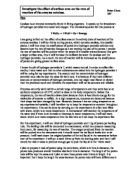
Diagram of equipment: