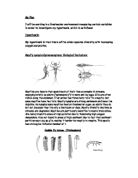
Mud passes through their bodies along with digestible material, which is removed on the way. The tail is used as a gill to obtain oxygen, as there is very little oxygen in muddy water. In waters, which is poorly oxygenated, a greater length of tail is extended. This allows the tubifex worn to live in area’s of poor water quality and low oxyegen saturations.
Key Variables
In order to obatin fair results a number of factors must remain the same. I must maintan a 20m distance, minimum, between each sites. Abiotic readings will always be taken before biotic, so not to disturb the site. With regards to abiotic readings, they must all be taken using the same tehnique, the meters will always be left dangling, without touching the surface as it will effect the outcome of the results. Area’s at each site, which will be investigated, will be chosen strictly randomly, also to make the investigation a fair test. My dependant or measured variable is species diversity, which I will obtain at each site. My independant variable is oxygen saturation, which will be effected in a number of ways. Many organisms living in water need to take oxygen from the water, some have special adaptions which enable them to use oxygen from the air, and so live in areas where theres little dissolved oxygen in the water. But the amount of dissolved oxygen in the water ius also effected by :
-
Temperature: The warmer the water is, the less oxygen can be dissolved in the water
-
Wave action and waterfalls: waterfalls and splashing waves increase the oxygen content because air is throughly mixed up with the water and oxygen from the air is more easily dissolved into the water.
-
Plant growth: Plants photosynthesize to produce oxygen, by day. This increases the oxygen content in the water. But by night photosynthesis can’t occur, due to no sunlight, so oxygen content in water decreases. This is because more oxygen is being taken in, than produced.
-
Decomposition: The biological process of rotting is brought by micro-organisms, which are living and require oxygen in order to decompose dead matter. If streams contain vast amount of dead matter, the micro-organisms are going to use the oxygen.
-
Light: Light can’t travel through water very well, and if the water surface is covered with abundant microscopic plants and animals, then oxygen content is indirectly decreased. This is because if there is limited light, then photosynthesis can’t occur and oxygen is used up quicker than it’s produced.
Hazardous Factors: Risk Assessment
When working in a freshwater environment, the following factors must be considered:
- Wind Chill- High wind speeds could make it very difficult to carry equipment and to obtain accurate results. Also high winds speeds could make conditions very cold.
- Muddy Banks and Beds- When taking abiotic and biotic readings, which involve coming close to the bank of the stream precautions, must taken. Wet banks from rain could make it hard to get close to the stream and take readings.
- Barbed Wire- Many area’s being investigated is located near or along side private or owned land, which border their land using barbed wire. When taking kick samples extra precautions must be taken to prevent falling onto barbed wire an injuring ones self.
- Hostile Vegetation- When working in environments like freshwater there is always a chance of hostile vegetation being present in that particular area. If unsure about vegetation use gloves before handling.
- Weils Disease- When handling equipment in the water gloves must be warm to reduce the risk of Weils disease, which will only enter the body through cuts. When washing trays or handling species inside tray then gloves must also be worn.
Method
The main aim was to investigate the species diversity in different area’s along a stream. One site being above the primary source of pollution (sewage works) and 3 site, with increasing distance , below the primary source of polluion.
Logically there should be a high species diversity at site one, due to it being above the source of pollution, hence a higher oxygen saturation. With concerns to data reading, abiotic reading were taken first, so not to distuburb any organisms living in that perticular area. The main reasons for taking abiotic reading was to determine the pollution state of each site along the site. The abiotic readings were as follows :
- A hydroprop- measures velocuty or flow of water, of that perticular area of stream (mm ¯1)
- Oxygen meter- mesures oxygen saturation as a percentage, also used for measuring temperature in ºCelcius.
- A conductivity meter- measures amount of sediment in the water, for that perticular area, in parts per million (ppm)
Also the following equipment was alos used :
- Net- for kick/sweep netting sampling techniques.
- White tray- used to plave species in
- Data sheet- Recording findings
- Key- helping indentification of species
At each site extra care was taken to obtain accurate reults. With the conductivity meter, readigs were taken every minute for 5 minutes in order to gain an overall avergae. With the oxygen meter no avergae was taken. The meter was left in the water for 5 minutes, but on many occasions the readings settled and din’t change after about 3 minutes, so that reading was taken to save time.
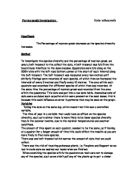
After completion of abiotic readings, biotic readings were taken. With each site there was a distance restriction between each site. There was a 20m interval between each site. This was to try and find a wider diversity, so if we are further away from each site, we should obtain different species. Also, with each site techniques varied depending on the surface state of each sire. At site one a ‘kick sample’ was used due to a solid surface, with little mud. Sites 2,3 and 4 required a ‘sweep netting’ technique due to a highly sedimented surface and unsuitable for ‘kick sampling’. Each technique involved either poking or kicking the surface in order to move the sediment about, and increase the chance of finding a higher species diversity. At each site a net would be used, and kicking or poking, whilst collecting, would only be going for one minute. This is to make sure it’s a fair test. This is an example of net sweeping :
- A net will be moved in a clockwise/anticlockwise direction in order to obtain species. A figure of 8 movement, with the net, would best suit this sampling technique, as it increase the chances of obtaining species.
- A long stick would be ideal to poke the surface of the site, as it will disturb the sediment and allow more species to be obtained.
This is an example of a kick sampling method:
- A net will be moved in a clockwise/anticlockwise direction in order to obtain species. A figure of 8 movement, with the net, would best suit this sampling technique, as it increase the chances of obtaining species.
- Moving feet forward and backwards, kicking the sediment, will allow the sediment to be broken up and allow species to enter the net.
Collected species were placed into a white tray, so that the species were easier to identify. But before all of this white tray was washed, to make identification easier. The trays were then filled with stream water, so that the species collected were able to move about, this is important because species movement is a key factor of identification. From the tray, the species were put into petri dishes, so that the species can be identified individually. This would be done using pipettes and a species key.
My findings were recorded in a table, in tally form:
I took two kick/sweep netting readings at each site in order to achieve an overall average at each site.
Another biotic factor that would indicate the pollution state at each site are high oxygen demanding species (mayfly) and low oxygen demanding species (rat-tailed maggot). The more there are of these types of species, the more polluted/unpolluted that area. These species are called biological indicator species.
Explanation of results: Conclusion
Site 1 was located above the primary source of pollution. The site gave a species diversity figure of 0.32 indicated using the Simpson-Yule diversity technique. In total mainly freshwater shrimps were collected, which are usually found in more oxygenated waters. Freshwater shrimps have a biological indicator number of 3. No mayflies, which are found in high-oxygenated areas and few rat-tailed maggots, which are found in low oxygenated areas, which a biological indicator number of 5 were found. The low species diversity was believed to be due to the sites shallow water and the state of the shallow water. The site ground was mainly made up of hard stone, which isn’t ideal for sensitive species such as the mayfly and the stonefly, as they like to get under rocks, but because of the hard surface they weren’t able to. The low species diversity was indicated at 0.32 using the Simpson-Yule technique. Species aren’t able to cope in area of high speed and low volumes, as they are continuously being moved about by the strong flow and little water. Pollution sensitive species such as stoneflies and some mayflies are eliminated by the pollution and communities become less diverse with tolerant species dominant.
The site was located just metres away from a small waterfall. This increased the velocity to 23.95ms¯1, and so more oxygen from the air should be dissolved into the water, but there were other factors that reduced the oxygen saturation. The area was very secluded, and very little light was able to enter the area. With very little light, photosynthesis would also be limited. Plants found in that area would produce little oxygen, as photosynthesis is not occurring enough. Surrounding species and bacteria would then use up the oxygen, and gradually the saturation would decrease. The ratio of oxygen being used: oxygen being produced is very high, so more oxygen is being used than it is being produced.
Another reason for the low oxygen saturation is that at site 1 the temperature was considerably higher than that of the other 3 sites. An increase in temperature means that less oxygen is able to dissolve in the water because the water itself can’t hold as much of the gas and decreases in solubility at high temperatures.
This graph shows direct effects of temperature on oxygen saturation:
From the results it’s able to conclude that raw water temperature, composition, treatment, and any chemical or biological processes taking place in the distribution system influences the dissolved oxygen content of water. A dissolved oxygen content substantially lower than its saturation concentration may indicate that undesirable processes are occurring, which may adversely affect water quality, such as agriculteral pollutants. The site was believed to have given anomalous results.
Site 2 was located directly below the primary source of pollution. The site gave a species diversity figure of 0.37 indicated from the Simpson-Yule technique. In total there was, once again, many freshwater shrimps found but also many Tubifex worms, flat worms and rat-tailed maggots. Overall there was a high species diversity, with many of them being low oxygen demanders indicating a slightly polluted water. The trend in low and high oxygen demanders was indicated at graph 3. This slightly polluted water may have arisen from a point source leak, which is where pollution enters the waters course via a crack in piping network of the sewage treatment. This was also indicated by an oxygen saturation of 38.5%, which is slightly lower than that of site 1. The amount of low oxygen demanders was also thought to be due to slow flowing water, which would decrease the amount of oxygen dissolved from the air into the water. But on the other hand the temperature of the site was relatively lower, than that of site 1, and remained constant from here onwards. This decrease in temperature should increase the solubility of the water, and so more oxygen should have been dissolved.
Reasons for the slightly lower oxygen maybe due to the presence of bacteria. In these areas sewage may’ve not been treated properly and bacteria build up at the site, to feed on the waste. In order for the bacteria to feast on the waste they will be requiring oxygen. This intake of oxygen isn’t being replaced because the water flowing is too slow to efficiently replace the oxygen by dissolving it back into the water from the atmosphere. Also the area is once again very dark and light is very limited. This will decrease the rate of photosynthesis in plants living in the water, and thus the amount of oxygen. Eutrophication wasn’t considered a factor because there weren’t any algae growing on the surface of the site.
Another reason for the depleted number of high oxygen demanders maybe due to the total dissolved solids at the site. The site gave a reading of 296.09 parts per million, this results show that the site has a lot of dissolved sediment in the water. With the low oxygen, the conditions aren’t ideal for high oxygen demanders like the mayfly who respire using gills. These gills can easily be blocked by sediment travelling in the water and can cause the death of the specie. This explains the limited number of mayflies, stoneflies and other high oxygen demanders.
Site 3 is located a minimum of 20 metres away from site 2, this site is further away from the primary source of pollution, so conditions of the site should be better than that of site 2. The site had larger species diversity than that of site 2. The reasons for this were that there was an increase in oxygen saturation. This increase came may’ve from the increase in velocity of the water. This would then dissolve more oxygen into the water. The area itself was a lot more open and light was able to penetrate into the water allowing the plants to photosynthesise thus increasing the oxygen saturation once again. The plants were replacing the oxygen being used by the species or bacteria and flowing water, allowing the saturation to remain higher. Another reason would as the water is flowing from site 2 to site 3 it is becoming cleaner, as the water is flowing further away from the primary source of pollution.
The temperature remained the same at 9.9 degrees Celsius, so this factor was eliminated, as the temperature at site 2 was also 9.9 degrees Celsius.
With this increase of oxygen, the site became more appealing to a wider range of species. The species diversity increased from 0.37, which was at site 2 to 0.49 at site 3. This was indicated using the Simpson-Yule technique. This diversity is backed up by graph 3 showing the number of high and low oxygen demanders. Both show an increase in species as you go from site 2-4. Also at this site the total dissolved solids in the flowing water decreased as the less solids were being deposited, but being carried. This is related to velocity, as it increases the water has more energy to carry the sediment rather than deposit it.
Site 4 was located even further away from the primary source of pollution and an increase in species diversity along with oxygen saturation was expected. IN total the site had a species diversity of 0.54, which once again increased from that of site 3. The oxygen saturation of the site was 40.5%, which also increases slightly from that of site 3. These results can be justified as follows. Then increase in oxygen came from overall cleaner water. This was due the site being further away from the primary source of pollution so many of the impurities and bacteria aren’t present, this the directly effects the oxygen saturation. Due to the absence of bacteria the oxygen is no longer being used by the bacteria but remaining in the water. This should then in turn increase the oxygen saturation drastically, but this isn’t the case. Even though there are fewer bacteria, this causes an increase in the number of species, so now there is more species using the oxygen, that’s why we only get a minute difference in oxygen saturation.
The velocity of the water decreases rapidly, allowing a calmer flow of water. This calmness is more appealing to species as they aren’t’ constantly being moved about by the flowing water. The decrease in flow also reduces the amount of sediment the water can carry as it’s loosing energy. This then reduces the amount of dissolved solid flowing in the water.
Once again the area is more open than secluded, allowing light to enter the site allowing any plants in the water to photosynthesise and thus replacing lost oxygen due to the slow flowing water.
How the experiment could be improved
The time allocated wasn’t long enough, as the investigation seemed rushed. Over a longer period of time, samples and species counts would have been repeated in order to get an accurate average overall. With more accurate results a better conclusion can be made.
Justification of Jacards Similarity Index
This test is very beneficial as it allows us to compare any two sites in terms of species composition. With this test we can see how dramitcally, for example, the species diversity changes between sites 1 and 4, 2 and 3 etc.
Justification of Simpson-Yule
This stats test is used to determine the species diversity at each site. This can be done by calculating the number of species observed at each site. If high species diversity is to appear then the species must be present is approximately equal numbers.
This stats test was seen to be useful as the species diversity can be related to the oxygen saturation and the presence or absence of species itself.
Justification of stats tests
The reason these two stats were used is that they give a good indication of species composition and how it changes as you go from site 1 to site 4.
Both stats test help justify the original hypothesis, as the species diversity and similarity between sites can be directly related to oxygen saturation.