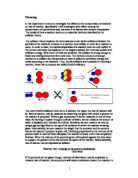
Finally, the concentration of the reactants may be used to increase the rate of reaction. In a substance of high concentration there are more particles per unit volume than in a substance of lower concentration. Higher concentration means there are more particles to collide with each other and thus a reaction is more likely, as shown below. The concentration of one of the reactants is the main variable that will be used in our experiment in order to establish its effect on a reaction.
Method
The aim of this experiment is to determine the effects of concentration on a reaction. Using my knowledge of the collision theory, I intend to construct an experiment to determine this. I will carry out a reaction a number of times, each time varying the concentration of one of the reactants. By then recording the time each experiment takes, and plotting this against the concentration used, we can look for a pattern. In the experiment I will react varying concentrations of diluted hydrochloric acid with sodium thiosulphate. A product of this reaction is sulphur in solid form. This forms as a cloudy precipitate in the solution. Hence, it is a visible indicator of the reaction, which can be used to measure the rate of reaction. The full equation for the reaction I will use is:
Sodium thiosulphate + hydrochloric acid + water = sodium chloride + sulphur
dioxide + sodium + water
Na2S2O3(aq) + 2HCl(aq) + H2O(l) = 2NaCl(aq) + SO2(g) + S(s) + H2O(l)
In order to obtain suitably accurate results, the concentrations used must be varied a number of times. I will use five different concentrations: 0.2 M, 0.4 M, 0.6 M, 0.8 M, and 1.0 M. These concentrations will be sufficient in range to give me accurate readings and will, I hope, when plotted against times, display a recognisable pattern.
I will first measure out 25cm³ of sodium thiosulphate and pour it into a conical flask. Then I will measure out and mix 5cm³ of hydrochloric acid and 25cm³ of water, and then add this solution to the sodium thiosulphate. I will then time the reaction using a stop-clock, by placing the flask over a thick black cross drawn on a piece of paper. When this cross is completely obscured by the sodium produced by the reaction, the stop-clock will be stopped and the time recorded. I will then repeat this experiment for each of the different hydrochloric acid concentrations. Once all the experiments are completed, their times can be compared to their corresponding concentrations in order to look for a trend.
The success of the experiment will rely to some extent on the accuracy to which it was carried out, as the final measurements will need to be quite precise in case they are spread over a small range. This is particularly important when it comes to measuring out quantities of solutions. For this reason I will choose measuring apparatus carefully according to the amount of solution required. For example, for the 25cm³ measurements I will use 50cm³ measuring cylinders, while for the 5cm³ measurements I will use 25cm³ measuring cylinders to ensure greater accuracy. All measurements will be read to the nearest appropriate unit, in this case the nearest cm³. This accuracy in measurement must be maintained throughout the experiment.
I will also use a stop-clock accurate to one-hundredth of a second – the most accurate available to me. As the measurement of the time relies on the reaction time of the timekeeper, the same person should take the readings throughout all the experiments. Furthermore, the point at which the stop-clock is started and stopped should be consistent. In this experiment the stop-clock will be started as soon as all of the last reactant has been added and stopped as soon as the cross is completely obscured.
In order to carry out this experiment I will require the following equipment:
2 measuring cylinders (50cm³),
1 measuring cylinder (25cm³),
1 conical flask,
1 stop-clock,
1 piece of paper with a thick black cross,
0.2M, 0.4M, 0.6M, 0.8M and 1.0M hydrochloric acid,
Sodium thiosulphate,
Water,
Safety goggles.
In order for the experiment to be as accurate as possible, it will need to be a fair test. This can be achieved by keeping certain variables constant. The amounts of each of the chemicals used must be consistent in all the experiments. As we are specifically testing the effects of concentration on rate of reaction, the other factors that may have effect must also be the same. We must therefore ensure that the temperature of the reactions is constant by conducting the whole experiment on the same day, assuming that there will be very little temperature change. Also, we must make certain that no catalysts are introduced to the solution. As all the reactants involved are liquid in form, their surface area – the final factor – will be constant throughout without intervention. It is important to avoid any physical interference with the solution as this may increase the rate of reaction by giving the particles kinetic energy.
Some variables however, do need to be changed for an experiment to be of any use. In this experiment I will change only one variable. This will be the concentration of hydrochloric acid used in each experiment. Each concentration will need to be measured accurately, in order that my results and conclusion will be as close as possible to the truth. The volume of solution I add to the solutions though, must remain the same.
Finally, repeating the experiment may increase the accuracy of the results. The larger the set of results you have to work with, when averaged the more precise they are likely to be. Also, with a number of results that can be compared anomalous results can be spotted more easily. I will therefore repeat the experiment for each concentration of hydrochloric acid three times. The results for each concentration can then be averaged, giving me a final set of precise results with which to work.
Predictions
The collision theory tells us that the higher the concentration of a solution is, the more particles it has per unit volume. It follows that the more particles there are, the more likely it is that collision and reaction will occur and the sooner the reaction will be over. My prediction therefore, is that as concentration increases so too does rate of reaction, i.e.: rate of reaction is directly proportionate to concentration. This prediction is illustrated in the diagram overleaf.
Obtaining Evidence
I carried out my experiment as detailed in the plan. I had to take note of safety measures, especially when using the hydrochloric acid, wearing goggles and avoiding any contact with skin. Accuracy too was important. The different substances were carefully measured and poured out first into measuring cylinders and then the flask in equal amounts, and the same person timed each reaction to an appropriate degree of accuracy. Finally, to ensure maximum accuracy, the equipment used was carefully washed and dried between each reaction.
For reliability the experiment was to be repeated three times. They are the final results from which I will draw my conclusions.
Analysis
I plotted my average results into two graphs (see over) for ease of display. As the results may be continuous according to the exact levels of each substance used in the reaction, line graphs are most appropriate to display the data. Also, as the data collected is not accurate enough to form a clear line, I used a line of best fit to represent the data in a single line as precisely as possible. The first graph plots the concentration of the hydrochloric acid against the rate of reaction (the reciprocals of the recorded times), and the second plots the concentrations against the unaltered time in seconds.
The first graph of concentration and rate of reaction displayed strong positive correlation allowing me to draw a clear line of best fit onto the graph. The data showed the rate of reaction to rise in line with the rise in concentration of hydrochloric acid. That is, it displayed direct proportionality to the concentration of hydrochloric acid used, thus proving my prediction. This must also mean that my theory is correct, and that an increase in the number of particles in a solution increases the likelihood of fruitful collision, thus speeding up the reaction. Hence, the occurrences in the five different experiments can be summed up in the diagrams displayed in the predictions section of this investigation.
The relationship between rate of reaction and correlation displayed in the first graph can be further explored and defined mathematically. Using the line of best fit, I can attempt to find a common rule linking the two factors in the form of an equation or general formula. As the graph shows a straight line of best fit, any formula will follow the format y = mx + c. In it, m represents the gradient of the line and c the point at which it crosses the vertical (y) axis. When applied to this set of data we can find values for m and c, allowing us to establish a formula of the form
concentration = m(rate of reaction) + c. As the graph does not extend below the x axis for obvious reasons, we will have to work out the values of m and c using simultaneous equations taken from the graph.
Concentration = m x rate of reaction + c
1 = 0.0255m + c (1)
0.4 = 0.016m + c (2)
Subtract equation (2) from equation (1):
0.6 = 0.0095m
0.6 / 0.0095 = m
m = 63.15789473684 …
m = 63.2 (1dp)
Substitute value of m back into one of the original equations:
0.4 = 0.016 x 63.2 + c
0.4 = 1.0112 + c
0.4 – 1.0112 = c
c= -0.6112
c= -0.6 (1dp)
These values can therefore be used to form the following general equation for the relationship between concentration (C) and rate of reaction (R):
C = 63.2R – 0.6
Or:
R = (C – 0.6)
63.2
And to check the accuracy of this formula we can substitute in some known values.
R = (1 – 0.6) / 63.2
R = 0.0632911 …
Clearly, unfortunately, the data is far to imprecise and spread over far too small a range to be able to find an accurate formula to summarise the data successfully, and hence the above formula produces wildly inaccurate results.
The second graph shows the relationship between the time a reaction takes and the concentration of the hydrochloric acid used in it. Here the data shows a negative relationship in the form of a quadratic curve. The information the graph supplies though is far too imprecise to draw any kind of mathematical conclusions. Instead it can be safely said that it shows that as the concentration used increases, the time the reaction takes decreases. This further supports my prediction that the higher the concentration used the faster the reaction and the higher the rate of reaction. Again, this can be explained by the collision theory. The higher the concentration, the more particles there are and the more likely it is that a fruitful reaction will occur. Thus, more fruitful reactions will occur in a shorter space of time, and all the reactants will be used up sooner causing the reaction to cease.
Evaluation
Overall I feel the experiment to have been quite successful. The experiments were fair tests, were well planned and were repeated 3 times, and hence were accurate enough to form a line of positive correlation when plotted on a graph, allowing me to draw in a line of best fit. This was sufficient to draw the conclusion that my predictions were correct.
However, I also feel that there are many ways in which the experiment could have been improved. When I came to analyse my results in more depth, it appeared that the data was spread over too small a range and was measured too inaccurately to draw any detailed conclusions. I put this largely down to having left the measurement of the end of the reaction to the human eye. It was very difficult to confidently decide that the reaction had ended, and so the precision of the times recorded varied. In order to combat this, the investigation could have been conducted using an alternative reaction where one of the products is a gas. This would allow far more accurate measurements as to the length of the reaction through using either weighing scales or a gas syringe to measure the amount of gas given off.
The reaction of hydrochloric acid and sodium thiosulphate varied so little across the different concentrations that the equipment used in the experiment was far too inaccurate. Even the tiniest of mistakes could make a big impact on the rate of reaction. The experiment simply was not a fair enough test to allow it to provide any more detailed information than to display a general pattern of the relationship between concentration and rate of reaction, though this was sufficient to conclude the investigation. More accuracy would have been useful in the measurement of the variables in the experiment, such as a more precise way in which to measure the amounts of solution used. This could be found in more precise measuring cylinders, some more precise way in which to pinpoint the end of a reaction, and particularly in a more accurate method of timekeeping which isn’t vulnerable to human inaccuracies. The exact measures that could be introduced to these effects however, are less clear without more specialist scientific knowledge.
There is plenty of scope for further investigation of this topic. The same investigation could be repeated with far more accurate methods of measurement, or it could be slightly altered to make the whole process more suited to the use of simple apparatus. This could be done by reacting the varying concentrations of hydrochloric acid with an alternative reactant that would produce a gas. It is far easier to measure a substance that leaves the solution than one that remains mixed-up within it. Alternatively, the investigation could be extended to investigate the effects of concentration of different acids, such as sulphuric or citric, on the rate of reaction, and determine whether these differ to the results given by hydrochloric acid. Finally, the other factors that affect rate of reaction – temperature, surface area and the use of a catalyst – would also provide interesting topics of study with which to compare the results of this investigation.
Bibliography
Lonsdale SRG: GCSE D/A Chemistry
Mary James
Chemistry for You
Lawrie Ryan
The Times: GCSE Chemistry
PC CD ROM
Hutchinson’s Multimedia Encyclopaedia
PC CD ROM