pushes hard against wall.
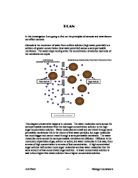
I plan to demonstrate the principles of osmosis by using potato cores. The potato cores will be left in different concentrations of sucrose solution over night. The weight before and after will be recorded and the percentage weight change will be recorded to compare the different concentrations.
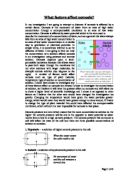
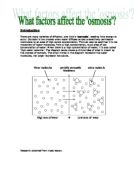
FACTORS AFFECTING OSMOSIS
There are three main factors that can affect osmosis; temperature of solution, concentration of solution and size of membrane. These are the controlled variables.
TEMPERATURE
If the temperature increases the particles have more energy and are free to move about more quickly. This causes the particles to diffuse across the semi-permeable membrane more quickly. Also if the temperature of solution is higher it will encourage the rate of osmosis. This is because the pressure on the outside increases and will speed up the activity of osmosis.
CONCENTRATION
The concentration of the solution will affect osmosis. If the concentration of the solution is higher osmosis will take place but if it is lower it may not be as affective. If the sucrose solution is higher in concentration than the potato then water will travel from the potato to the solution, the potato will reduce in weight. But if the concentration of sucrose solution is lower than in the potato water will travel from the solution to the potato, this will increase the weight of the potato.
SIZE
If the size of membrane is bigger and the concentration of solution is lower than in the potato then more water will travel into the potato from the solution but the percentage weight change will be the same. However if the concentration is higher then more water will travel from the potato to the solution but still the percentage weight will be the same.
In the experiment that I am planning I will be using 6 concentrations of solution measured in moles per dm3:
H2O (0 moles), 0.1 moles, 0.2 moles, 0.3 moles, 0.4 moles & 0.5 moles.
PREDICTIONS
I predict that in the solution H2O, 0.1M and 0.2M the concentration of the solution will be lower that the concentration of the potato so water will travel from the solution to the potato increasing the weight of the potato. In the solution of 0.3M the concentration should be similar to the concentration of the potato so the weight of the potato should stay about the same and there should be little water movement. In the solution of 0.4M and 0.5M the concentration of the solution should be higher than the concentration of the potato so water will travel from the potato to the solution and the potato will decrease in mass.
All of the water movement that takes place will be the movement of water molecules across a semi-permeable membrane (tiny holes in the membrane of the potato) from a solution of low concentration of solution (sucrose) to a high concentration by osmosis.
METHOD
I will use a cork borer to take 6 cores from a potato at roughly the same lengths. I will then use a paper towel to soak up as much of the surface moisture, on the potato core, as possible, then I will weigh them and cut them down with a knife so that all of them are exactly the same weight to 2d.p. in grams and the weight will be recorded. There will be six test tubes containing 10.0cm3 of solution they will be; H2O (0M), 0.1 moles, 0.2 moles, 0.3 moles, 0.4 moles & 0.5 moles. One core will be place in each of the test tubes and left over night. The test tubes will be covered up with paper towels to prevent any evaporation. After they have been left over night I will take the cores out and dry off the surface moisture using a paper towel. I will then reweigh the cores and calculate the percentage weight change.
APPARATUS DIAGRAM
- 6 test tubes
- Test tube rack
- 1 potato
- 6 concentrations of solution;
H2O (0M), 0.1M, 0.2M, 0.3M, 0.4M & 0.5M Solution
- Measuring cylinder
- Knife
-
Weighing balance Potato
-
Cork borer core
- Paper towels
I will make this experiment a fair test by using the same potato for the cores because different potatoes may have different concentrations. I will also make sure that the amount of solution I use each time is exactly 10.0cm3 and the weight of the cores are exactly the same to 2d.p. in grams. I will also make sure that the cores are in the solutions for the same amount of time. I will leave them over night (24 hours) so that there is enough time for the whole process of osmosis to take place. All of the test tubes will be placed in the same test tube rack in the same place where the temperature will be the same.
SAFETY ASSESMENT
I will be using a knife in this experiment to cut the potatoes. The knife will be sharp so it will be dangerous. When I am using the knife I will take special care to cut away from myself and keep my fingers away. I will also put the knife away in a safe place when it is not being used.
RESULTS
This is my table of results which contains the weight before and after and the percentage weight change. I calculated the percentage weight change by using the weight after divided by the weight before, multiplied by 100 and then minus 100.
(Weight After / Weight Before * 100 – 100)
I have produced a graph to show these results.
ANALYSIS
The results show that my prediction was almost correct. The results show that H2O, 0.1M and 0.2M had a lower concentration than the potato which is why the potato increased in weight by water by water diffusing across the concentration gradient and through the semi-permeable membrane from the solution to the potato. The potato cells would have become turgid in these solutions. It also shows that 0.3M, 0.4M and 0.5M had a lower concentration than the potato which is why the weight of the potato decreased by water diffusing across the concentration gradient and through the semi-permeable membrane from the potato to the solution. The potato cells would have become plasmolysed here. In the solution of 0.3M the weight decreased by 1.7% this means that the concentration of the potato was very close to 0.3M. But to get a more accurate idea of what the concentration of the potato was I can refer to the best-fit line on my graph and where it crosses the x-axis would be an estimate of the concentration of the potato. The estimate of the concentration of the potato is 0.235M.
All of the water movement that had taken place would have been the movement of water molecules across a semi-permeable membrane (tiny holes in the membrane of the potato) from a solution of low concentration of solution (sucrose) to a high concentration by osmosis.
On the graph a best-fit line could be drawn quite easily and there were no anomalous results. The graph shows that the experiment was accurate because all of the points on the graph fall on or very close to the best-fit line but there is still room for improvement.
The graph results show that osmosis did take place.
All of the solutions of sucrose were measured in moles per dm-3.
EVALUATION
I believe that my results were sufficient enough to prove what happens in osmosis but there are still many ways to improve the experiment to make the results more accurate. There were no anomalies in my results which is why I was able to draw a best-fit line easily.
If I were to do this experiment again there are a number of changes that I would make. I would choose a wider range of concentrations at smaller intervals so that a graph can be more detailed and more accurate. If it were possible I would use a more accurate weighing balance to 4d.p. in grams. Drying off the surface of the potato cores reduced the weight somewhat but using a paper towel wasn’t going to be the same on each core. If I were to do this again I would develop a more accurate and uniform way of drying the cores. I would also do one solution at a time so that when the cores are sitting on the paper towel waiting to be weighed they do not lose more weight. One of the most important improvements would be to do more repeat experiments and use averages. Also I would use different membranes other than potatoes and different solutions other than sucrose.
There are errors in this experiment which influence the reliability of the data. Cores slough of the cells while they are in the solution which reduces the mass of the cores which will influence the weight at the end.
Although there were no anomalous results I think the best-fit line could have been more accurate if the results had been more accurate. But there is sufficient information, by looking at the graph and analysis, to prove that osmosis did takes place and that my theories in my plan are correct.
Overall I think this was a very successful investigation and the results I obtained show that osmosis did take place.