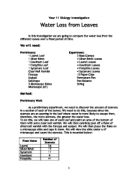
Method:
Preliminary Work
As a preliminary experiment, we need to discover the amount of stomata in a section of each of the leaves. We need to do this, because since the stomata are an opening in the leaf where water is more likely to escape from, therefore, the more stomata, the greater the water loss.
To do this, we will take one of each leaf and paint an area of the bottom of them with some clear nail varnish. We will then carefully peel off a flake of dried nail varnish with the forceps and scalpel. We will then place the flake on a microscope slide and tape it down. We will view the slide under a x7 microscope and count the stomata. This is recorded below:
Experiment:
We are going to take 3 leaves of each different type and number each leaf 1 to 3 using a permanent pen on the top surface of the leaf. We are writing on the top surface because the pen is less likely to block up stomata because of the cuticle. We are using 3 leaves of each type so we can use repeat experiment results. These repeat results will mean we can average the results and the experiment will, therefore, be fairer. We will set up a ‘washing line’ to hang the leaves from using two boss stands and some string. We will then weigh each of the 15 leaves and record the measurements as the start weight in the tables below. We will then attach each leaf to the line with paperclips. We are using the ‘leaf line’ because they will all then have an equal amount of air circulating around them which will mean they will lose their water content as impartially as possible. We will re-weigh the leaves at several intervals over the following two days. The start weight is zero hours, we will weigh again at three hours, again at 24 hours, again at 27 hours, and finally at 52 hours. We will record the measurements in tables below and calculate the total water lost from each species of leaf.
Diagram:
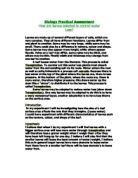
Prediction:
The leaf with the most stomata in the recorded area should, theoretically, lose the most water content over time. This is because the stomata are openings in the leaf’s outer layer through which carbon dioxide enters and oxygen leaves the leaf. However, this is not necessarily a true theory, since leaves with thicker cuticles will lose less water over time than the other leaves, irrespectively of whether it has more stomata.
Results:
Laurel
Silver Birch
Sycamore
Hawthorn
Forsythia
Averaged Results and Percentages:
Laurel
Silver Birch
Sycamore
Hawthorn
Forsythia
Total Loss
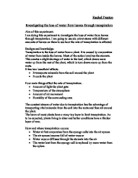
Conclusion:
I conclude that the Silver Birch lost the most water over time and the Laurel lost the least water. The water loss rank is shown below. It is in order of when the leafs stopped losing water.
- Silver Birch
- Sycamore
- Hawthorn
- Forsythia
- Laurel
As many of the leaves reached a point when water was no longer lost, and they then gained weight from the moisture in the air, I have concluded the order based on when the leaves stopped losing water. The Sycamore and the Silver Birch leafs appeared to stop losing water at approximately 24 hours, where as the Hawthorn stopped losing at approximately 27 hours and the Laurel and the Forsythia showed no signs of ceasing to lose water. This was presumably because of the thick cuticles as both of the leafs had a large amount of stomata.
These results fit with my prediction, as the laurel (with thick cuticle although many stomata) lost the least water.
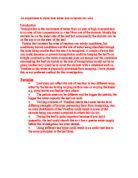
Evaluation:
We tried hard to make sure our experiment was carried out in a fair and impartial way.
We used repeat experiments with averaged results and percentages to ensure any anomalous results would not be accepted as true. However, there were several things that were not done as fairly as they could have been.
One of these things was that the pen used to number the leaves could have blocked up stomata in the leaf. To reduce this possibility we numbered the upper surface of the leaf, which has less stomata and a thicker cuticle, but it still could have caused unfairness.
Another possible biased problem, was that the leaf weighed last, out of all 15, may have lost more moisture during the time it took to get from weighing the first leaf to weighing the last leaf. To get around this problem the leaves would have had to be weighed in as shorter time as possible.
Also, as I stated in the conclusion, the leaves, once all the moisture was lost, gained weight from the moisture in the air. This accounts for the anomalous results we recorded. The only way to reduce this being a problem is to hang the leaves in controlled atmospheric conditions, and there are not facilities to do this at school.
Another problem was that, as the leaves became drier they became crisp and the paper clips we used to attach them to the line broke the leaves when we removed or attached them to the line. The best way to solve this problem would be to use something that would make it easier to attach the leaves to the line, like pegs.
The final problem we came across was that the weighing times were not evenly spaced so the graph drawn was not as accurate as it would have been nice to have been. Unfortunately, it is not possible for us to resolve this problem, as we could not have weighed the leaves in the middle of the night, for example, or during other lessons.
All in all I feel the experiment worked well, however it would have been nice to have continued the experiment over a longer time period so that we could see how long the Laurel and Forsythia take for all the moisture to leave the leafs as they did not fully dry out in the 52 hours we could use.
To further the experiment, we could investigate the amount of water lost from both surfaces of the leaves individually, instead of just using the total loss from the leaves in their entirety.