Going from reactants to the top of the curve, you are going up the energy scale. Energy is being put in to break bonds in the reactants.
At the top of the curve, the bonds in the reactants have been broken. The amount of energy put in to break these bonds is called the activation energy.
The activation energy is the minimum amount of energy needed for the reaction to occur. A may work by lowering the activation energy required for a reaction therefore increasing the amount of fruitful collisions.
Going from the top of the curve to the products, you are going down the energy scale. Energy is given out as bonds form in the products. The difference is showing the energy released from forming these bonds.
The reactants are higher up the energy scale than are the products. The amount of energy you need to put in is less than the amount of energy you get out.
This is a typical exothermic reaction.
The difference in energy levels between the reactants and the products is given the symbol ΔH. This is the amount of heat given out during the reaction because the energy content of the reactants is greater than the energy content of the products in an exothermic reaction.
For an exothermic reaction, ΔH is negative. For an endothermic reaction, ΔH is positive.
The change in heat is equal to the energy of products minus the energy of reactants.
This diagram shows how the acid concentration remains constant but the hydrochloric acid concentration varies.
The Chemical formula for our experiment is:
Sodium Carbonate + Hydrochloric acidCalcium Chloride + Carbon Dioxide +Water
CaCO3 (s) 2HCl (aq) CaCl2(aq) CO2(g) H2O(l)
I will look to see if there is a pattern between my results for example if the concentration doubles then the rate of reaction doubles.
To gather results I will be testing different concentrations and for each concentration taking a measurement of how much carbon dioxide has been produced every five seconds.
Because of Archimedes principal we are able to see how much carbon dioxide is produced because he discovered that the amount of water displaced out of the measuring cylinder would be equal to the amount of carbon dioxide produced.
From preliminary research I can guess that my graph of results will not be a straight line but probably a curve because the reaction will not be able to continue at this speed throughout the reaction this is because many of the reactants will have already reacted and therefore collisions will be less frequent and it will take longer for a collision to take place thus reducing the rate of reaction.
Preliminary experiment
I started by using 2g of marble chips with 200ml of hydrochloric acid. However, this reaction was too quick to measure and so we decided to use 1.5g of marble chips.
Fair Testing
- I am using a stopwatch to measure the time so I can accurately take readings from the measuring cylinder.
- The experiment will be done at room temperature so as not to effect the reaction.
- I will keep all except variables the same such as temperature, surface area, enzymes and catalyses.
Safety
- Goggles will be worn at all times.
- Chemicals will not be drunk, as they are dangerous.
- Beware of spillages. HCl is corrosive.
- Keep long hair tied back.
- Keep all obstruction away from walking aisles.
- Stand up in case of a spillage, you cannot move quickly when sitting.
Variables
- I have decided to vary the concentration of the hydrochloric acid by adding water to it. I am going to start using a concentration of 100% acid then work down in 20’s for example next we would take a reading for 80% acid and 20% water this would be done by using 150ml of acid and 40 ml of water.
- The temperature of the HCl solution will remain the same.
- The temperature of the Calcium carbonate will also not vary throughout the experiment.
Apparatus
Conical Flask,
Measuring cylinder,
Stopwatch,
Rubber tubing,
Bung,
Clamp and stand.
Limits of Accuracy
We have decided to measure the calcium carbonate to 2 decimal places on an electric scale, which is very accurate. Throughout the experiment we will try to be as accurate as possible and therefore we will measure time to the nearest second and hydrochloric acid to the nearest mm. I believe that measuring to closer than this might give us inaccurate results because we would not be able to take the measurement accurately enough.
Method
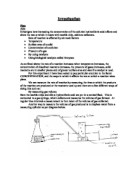
This method will be repeated for the 5 different concentrations.
Firstly set up apparatus as shown above.
Measure out the hydrochloric acid and water solution (200ml).
Weigh out 1.5g of Calcium Carbonate (marble chips).
Prepare a table to record your results.
- Pour the Calcium carbonate into the conical flask.
- Now also pour in your solution of hydrochloric acid and water.
- Place the bung on top of the conical flask and start your stopwatch.
- Every five seconds take a measurement of the water displaced by the carbon dioxide produced in the measuring cylinder.
- Now repeat this for every different concentration.
Table of Results
Analysis
It is obvious from my graph that there is a strong positive correlation and that with time the gradient decreases causing a gentle curve of best fit to be formed.
To prove this I will from my graph write the gradients between 0 and 5 seconds at the beginning of the reaction and between 55 and 60 seconds at the end.
To work out the gradients I used my graph and the equation:
Gradient = Rise
Run
This consists of dividing the value of the Y-axis by the value of the X-axis.
We can see from the table that there is a large difference in gradient between the two periods of time, the rate of reaction is much faster in the first five seconds than in the last this is because at the beginning of the experiment there is more un-reacted particles and therefore more fruitful collisions can take place, at the end of the experiment most particles are reacted and therefore the chance of a fruitful collision taking place is less likely this is because there is a longer space in time between two un-reacted particles meeting each other and thus slowing the rate of reaction. This supports my original collision theory.
I also noticed that in the last five seconds of the reaction between hydrochloric acid of strength 60 % and calcium carbonate the gradient was 0 this is because the last two readings were 51, this could be due to an error of slightly inaccurate measuring or it could imply that the reaction was no longer accelerating meaning the reaction was levelling off and reacting at a constant rate.
As you can see by the difference in gradient between the first five seconds and the last, this levelling off would eventually happen in the reaction for each of the five concentrations.
My final conclusion, which I gathered from my graph and results, was that as time increased so did the amount of C02 produced, this tells us that more particles reacted with time. However as time increased the gradient of my graph declined forming a gentle curve and showing that the rate of reaction slowed. This agrees with my original prediction about the positive relationship between the amount of carbon dioxide and time.
I can also tell from my graph that as the concentration of the hydrochloric acid solution was stronger, more CO2 was produced thus proving more products were formed. I believe this is because when the solution was stronger there were more acid particles to water particles and therefore more particles to react with the calcium carbonate (not necessarily meaning the experiment would last for longer and more product would be formed because we would still only have 1.5g of calcium carbonate). However showing that there would be a rise in rate of reaction because it would take less time for a calcium carbonate particle to meet a hydrochloric particle and result in a fruitful collision if there were more hydrochloric particles present.
Also my hypothesis was correct it was an exothermic reaction, this means when the bonds were broken less energy was used up the energy that was released when new bonds were made resulting in heat being given out.
Looking at my graph I would say that the difference in average gradient after 20 seconds and between 20 and 40 seconds is the same for each concentration this would prove that the rate of reaction decreases by the same amount for each concentration. I will work out the gradients to prove this.
I was right, we can see that the difference in gradient is very similar between the different concentrations meaning that the rate of reaction falls by the same amount each time. This also proves that the gradient is equal to the rate of reaction.
I can now determine that an increase in concentration results in an increase in rate of reaction.
Evaluation
I think I have been successful in determining how concentration affects the rate of reaction and have produced reliable results.
However there were a number of factors, which could have affected my results.
Measuring the volumes of the liquids could have been inaccurate. Errors in co-ordinating the stopwatch starting and adding the HCl solution to the sodium carbonate could have taken place. Also errors could have occurred when readings were being taken, they could not have been every five seconds and there might have been slightly inaccurate measuring. Different people using the stopwatch, measuring liquids and taking measurements could have caused an anomaly.
Also the experiment was not all performed on the same day and therefore the room temperature will not have remained the same, this could have caused inaccurate results.
I think my results were fairly accurate because they all lie near the line of best fit on my graph. On the results table and graph are only the average readings, we took three readings for each five seconds for each concentration. These readings were all fairly similar and where they were not we took extra readings. This enforces that my results are reliable because I am recording similar results for each time I do the experiment.
I had one anomalous result at 80% concentration and 25 seconds; I looked at my results and discovered that all the measurements for this reading are fairly similar therefore the problem may be that all 3 readings were wrong or that the time was measured incorrectly.
To improve the reliability of my data I could use more concentrations, measuring at 10% and 20% and so on.
I could also use a different reaction such as the sodium thiosulphate, this reaction forms a cloudy precipitate and therefore I could place a light over the top of the beaker and a data logger underneath I could then record at what time the light could no longer be detected by a light detector using a data logger and computer this would produce very accurate and reliable results as there would be little room for human error. This reaction would be a useful way of seeing how concentration affected rate of reaction.
To extend my research on this experiment I could try to discover if there was a maximum temperature where all particles gain sufficient EA to react with HCl and so the times and rate of reaction would not change past this point.
I could also see where there was a maximum concentration, where there was no more HCl particles left to react with the sodium carbonate and thus discover where the graph levels off.
I could investigate how temperature affects the rate of reaction. I could use a temperature probe connected to a computer to record the temperatures. Also a thermostatically controlled water bath could be used so the temperature would remain at a constant.
I could also work on the effect of surface area with mass remaining constant; this would show whether the rate of reaction follows a similar pattern when the surface area is increased to the pattern already found in my concentration experiment. What correlation if any could be found between results with surface area?
This graph is a prediction
Another research route could be to investigate catalysts and there effect on rate of reaction by reducing the activation energy required for the reaction to occur.
The effect of pressure could also be researched is there a pattern between concentration and pressure because of particles being squashed into a smaller volume? If this is the case as the pressure increases so will the rate of reaction.
To improve my experiment I could look at similar experiments that others have done in books or on the Internet. I could compare their results with mine and see how they have done their experiment differently to help me improve my method. I could also look at the different theories they have about their experiment to give me extra ideas on how to improve on how I have analysed my results. Other people’s work could also give me more research routes, which could be explored.