To ensure that we get a good set of results, we will do each test three times, and then find the average heat loss for each set of times.
To make the test more fair, we will use the same beaker each time, so that the size and thickness of the beaker stays the same each time. We will also use the same amount of water each time, and use the same type of paper towels, so that they are also all the same thickness.
To make sure that the experiment is done safely, we will do all of the tests on a clean work surface so that nothing gets broken, and we will be careful when using the kettle, so as not to burn anything with the hot water.
Obtaining Results
We will do each test three times, and record the results in the upper table, and then find the average result in the lower table.
All of these results start from 50˚C.
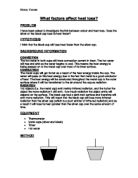
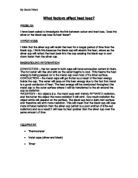
To obtain all of the above evidence, we used:
- One glass beaker
- A large amount of paper towels
- A kettle (to boil the water)
- A tap (for the cold water)
- A digital thermometer
- A digital stop watch
We used a digital thermometer because it is a lot more accurate than a mercury thermometer, and can measure temperatures to one decimal point, which is not possible with a mercury thermometer.
Firstly, we took the glass beaker, and filled it with 50ml of hot water, and added cold water until the temperature measured 50˚C on the digital thermometer. We then started the timer, and recorded the temperature at 2 minute intervals, for 10 minutes. We then repeated this, but wrapping 5 paper towels around the outside of the beaker before adding any water, and recorded these results. We continued to do this, adding paper towels each time, and repeated each test 3 times to make it more reliable.
My predictions were that the temperature would not fall very much, as it is only over a 10 minute period, and that, as more paper towels were added, the temperature would drop even less and slower, because the paper towels would insulate the beaker, and keep the heat from the water inside the beaker.
As you can see from my results, my predictions were correct.
Analysis of Results
To make analysing my results easier, I have decided to put them into a graph.
(see graph).
By looking at my graph, I can easily tell that my results are very wrong. There are a few reasons why these could be wrong.
- Bad obtaining of results – I may have read the thermometer wrong at times, and made it out of line.
- I could have written the times down in the wrong boxes in the results table
- The water temperature could have been started at wrong temperatures
- I may have obtained the results at intervals other than 2 minutes
Looking at the graph, I think that one of the tables of results was done badly, and when finding the average, these results made the average wrong.
Conclusion
The first two results tables show, in a way, that the temperature does drop slower with more towels wrapped around the beaker. Therefore, I have found out that insulation helps to contain heat in one place. If I was to re-do this experiment, I would take a lot more care when taking all of the results, as I think that is where I went wrong.