There are no apparent health or safety risks which require special procedure.
Variables:
Independant Variable - Concentration of salt solution
Dependant Variable - Change in mass of potato
Control Variables - Volume of liquid
- Weighing apparatus
- Length of time submerged in solution
- Temperature of solution
Equipment
5ml syringes (2)
test tubes (6)
Test tube rack
Potato slice
Electronic balance
paper towels
Glass beaker (2)
Scalpel
Stop watch
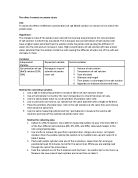
Method
First of all, 6 test tubes of salt solution at varying concentration would be set up and placed into a test tube rack. The following procedure would be followed to produce the different concentrations of salt solution:
Test tube 6: 10mg of 1M salt solution
Test tube 5: 8mg of 1M salt solution, 2mg of water
Test tube 4: 6mg of 1M salt solution, 4mg of water
Test tube 3: 4mg of 1M salt solution, 6mg of water
Test tube 2: 2mg of 1M salt solution, 8mg of water
Test tube 1: 10mg of water
The water and the concentrated salt solution will be poured into seperate beakers in order to allow ease of measurement. These measurements will be taken using a syringe in order to accuratley and fairly measure amounts. A seperate syringe will be used for the salt solution and the water in order to prevent contamination.
Then cut 6 fries from the potato slice of equal length and width using the scalpel.
Weigh the fries and record the details.
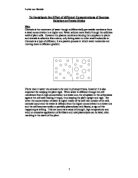
Place the first piece of potato into the first test tube and start the stop watch.
Place the other pieces of potato into the corresponding test tubes at 10 second intervals, noting the order and recording which potato piece goes into which salt solution.
Once 25 minutes has passed, remove the first potato piece and carefully remove excess water with a paper towel.
Remove the other potato pieces in the order in which they were put into the test tubes at 10 second intervals.
Weigh each potato piece individualy using the electronic balance and record its mass in a table.
Conclusion
The results confirm my hypothesis. The negative corelation between the change in mass and the salt concentration shows that as the concentration rises, the mass falls. the graph also shows that the expected point at which no osmosis would occur is just over 0.1M. The curve of the graph leads me to believe that the rate of increase in osmosis would decrease and above a certain concetration of salt solution, there would be no difference in the decrease in mass due to plasmolysis. In order to test this I would need to continue te experiment with higher concentrations of salt. There was insufficient difference in concentration of the pure water in test tube 1 and the concentration of the solution inside the potato cells to show whether osmotic pressure had an effect. In order to test this I may be able to do so with very dilute solutions using distiled water, but my available apparatus would not measure to the required degree of accuracy. The range of concentrations was suitable as it allowed a large enough variety with which to draw an accurate curve.
Evaluation
The experiment was fair as all major control variables were kept the same to the best of my ability. The different concentrations were begun at approximatley the same time so the laboratory conditions would have been maintained. Though the intervals at which i measured concentration were suitably reliable, i feel that it would have been more accurate to have done intervals of 0.1 or 0.05 molar in order to prove that the curve was indeed as shown in this experiment. Iwould also have liked to increase the concentrations of the salt solutions in order to extent my graph and examine the extremities of the experiment. In order to find out whether osmotic pressure played a part in lowering the rate of osmosis, it would be possible to use very low concentrations and leave the potato pieces sumerged for a greater length of time.
There was one anomylous result at 0.6M salt solution the mass decreased by 26.2% whearas i expected a drop of 30%. This may be because a larger surface area of the potato slice was in contact with the test tube resulting in a lesser surface area and so a slowed rate of osmosis. If possible I would repeat this concentration again in order to gain a more accurate average.
Other experiments which could be done to investigate the rate of osmosis on potato cells would be to have the same concentration of salt solution but to leave the potato pieces submerged for different lengths of time. This would accuratley allow u to determine the rate at which osmosis occurs at different concentraions and how the rate changes as the concentration nears equilibrium.
One of the problems with this experiment is that the potato pieces were put onto a paper towel before being weighed. The difference in time taken from removal from the solution to weighig may have had an effect on the results. A solution to this would be to stagger the start and finnish times even more in order to be able to remove and weigh each potato piece before removing the following piece.
Another way to vary the rate of osmosis would be to alter the temperature at which the solutions were kept. This could be done usig water baths and a thermostat. Though I have no previous experience in altering this variable in an osmosis experiment, I believe that the extra heat energy present in the water molecules would speed up the rate of osmosis.
The surface area of the potato could be changed while maintaining its mass by covering the sides of a piece or merely leaving the skin on which would act as a barrier and prevent osmosis on that surface. As all of these factors contribute to osmosis it woul be necesarry to take them into consideration when doing further experimental work.
Taking into account the aparatus that was available to me I believe I carried out my experiment fairly and produced reliable results from which to draw conclusions. I am pleased with the overall results as any anomolous results were close enough to the expected result that they do not discredit the experiment.