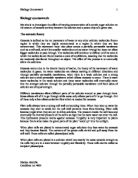
In the picture above the concentration of water inside the cell and outside the cell is the same so there is an equal flow in both directions as the pressure is equal on either side of the cell membrane.
{If there is a high concentration of water there will be less dissolved solutes (1-3%) if there is a low concentration of water there will be a lot of dissolved solutes.(70-90%)}
Preliminary work
Experiment 1
Aim: To gain a rough idea of how osmosis works by doing a simple and quick experiment.
Apparatus: two potato cylinders, distilled water, two beakers, NaCl solution, timer, weighing machine.
Method: I had used two solutions, one is a high concentration (distilled water) and the other is a low concentration solution (NaCl). I used two potato chips as my cells and placed one in each solution. I left the potato chips inside the solutions for 20 minutes. I then measured the weight of the potato chip before and after the experiment.
Results
Conclusion
The results shows that the mass of the chip that was placed in distilled water had increased proving that there was a lower concentration inside the potato chip, so the high concentration outside would have moved into the low concentration inside the potato chip. Therefore, increasing the mass of the chip.
The results also showed that the mass of the potato chip that was placed in NaCl solution had decreased proving that the concentration of the water inside the potato chip was higher than the concentration of NaCl so the water moved out of the chip hence, decreasing the mass.
Prediction
I have concluded a prediction from the scientific knowledge that I have gathered and from my results from the preliminary experiment that I have done. I found that in the experiment that I conducted and the scientific knowledge that high concentration always flows into the low concentration, So if there is a high concentration of water on the outside of a cell it will flow into the cell and if there is a high concentration inside the cell the water will move out of the cell.
Therefore I have come to a prediction for my experiments that I am going to conduct. I predict that if there is a high concentration of water outside a cell and a low concentration of water inside the cell and if the membrane of that cell is selectively permeable. The high concentration of water will move into the cell replacing the low concentration of water.
On the other hand if there is a higher concentration of water inside the cell and a lower concentration of water outside the cell the higher concentration of water will move out of the cell replacing the lower concentration of water outside. I believe that this is what will happen until the solutions on each side are equal and if the concentration continues to changes the reverse will happen inside the cell.
I think that the more concentrated a solution is outside a cell, after a given amount of time the cell will become turgid, given that the inside concentration is lower than the outside concentration. The lower the concentration of water outside the cell, after a given set of time, the more flaccid a cell will become. I predict that the higher the concentration of water outside a cell the higher the mass of the cell will increase and the lower the concentration of water outside the cell the lower the mass of the cell will decrease.
Factors affecting osmosis
The factors that affect osmosis are the different conditions that will affect the flow of the water molecules moving in and out of a cell. The different factors that affect osmosis are:
- The type of membrane- there are different types of membranes some of which allow all of a solution to pass through, some allow only part of the solution to pass through and some are selectively permeable. Only selectively permeable membranes will allow osmosis to occur.
- Temperature- A high temperature means that there will be a higher rate of osmosis that occurs as in a higher temperature water molecules are given more energy and so they will move quicker in and out of a cell. If there is a lower temperature there will be lower energy to each water molecule and so they will move slowly through the cell membranes. So there will be a decrease in osmosis
- Concentration of water- if there is a high water concentration there will be osmosis as it will replace the space of the low water concentration. If both solutions are the same concentration there will not be any dramatic change but only the constant movement of water molecules in and out of the cells in equal proportions.
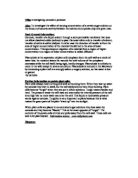
High water concentration less dissolved solutes
Low water concentration more dissolved solutes
Diffusion gradient
High water
Concentration
Osmosis Low water
Concentration
A B
Accuracy, reliability and variables
To make sure my results are accurate and I am going to look through the factors that will affect osmosis and I am going to make sure they are all correct. So I am going to:
- use a selectively permeable membrane
- Use correct and accurate concentration of solutions
- Do the experiment in a constant temperature
- Make sure the timing used for each part is equal and appropriate
- Try and repeat the practical to find a more accurate and reliable results.
To insure that all my results are reliable enough to bring to a decent conclusion i am going to use my teachers experiment results to compare.
To create a fair test certain aspects of the experiment will have to be kept the same whilst one key variable is changed. I have chosen to vary the concentration of the sugar solution. This will give me a vary varied set of results from which I hope to make a decent conclusion. If any of the non-variables are not kept constant it would mean it would not be a fair test. For example, if one of the potato chips was 1cm longer the surface area of the chip would be larger and there would therefore be more space for osmosis to occur. Doing all the tests at one temperature will control the temperature.
For the purpose of my experiment I am going to do all the experiments at room temperature.
To keep the water potential of the potato initially will be kept the same by using the same type of potato, which have been treated in the same way, e.g. have all been cut without being washed and peeled.
The mass of the potato is a dependent variable, and this means that it will be measured throughout the experiment. I will measure the mass in grams. The potato chip will be measured before it is put in the solution, and after. This will allow us to see whether osmosis has taken place,and to what extent. The volume of the solution that the potato chips are kept in must be fair. They must be completely covered in the solution, and the amount of solution will be kept the same because all the potato chips are the same size.
I am also going to use the same balance to weigh my potato chips. This is because the measurements may slightly vary between scales.
Strategy
My practical is being done to prove my prediction correct or incorrect. I have decided that I am going to use six concentrations of solutions each with a difference of two concentrations. The practical is going to be repeated two times. The first time, the concentrations used will range of readings that have a reasonable gap, enough to plot graphs and see if my prediction was correct. From the results that this experiment will provide me with, I can make an accurate conclusion, I can also find out the points where the osmosis reaches the isotonic point. I can then find the particular range of readings in my results where the concentration is the same inside and outside. I will develop my experiment into a deeper investigation using closer range of readings to find the exact point where the concentration is the same on both sides. I am going to use a range of reading with a difference of 0.2molars concentration for my experiment. The reading that will be used are; 0m, 0.2m. 0.4m, 0.6m, 0.8m, 1.0m. A digital weight will be used to make sure my readings are accurate.
I think that if I used smaller unit I would be more accurate with my results so I am going to be using small units e.g. mm, ml, molars etc for my results. I am going to make sure that I do all my experiment in a constant temperature. This is the variable that I have to control and the variable that I have to change is the concentration of solutions.
Practical
Apparatus
Distilled water- 25ml
Sucrose solutions of 0m, 0.2m.0.4m,0.6m,0.8m,1.0m – 25ml of each concentration
Boiling tubes-6
Digital weighing machine-1
Knife-1
Potato-1
Cork borer-1
Stop watch-1
Method planning
A range of sucrose sugar solutions will be prepared with concentrations of molars varying from 0m, 0.2m,0.4m,0.6m,0.8m,1.0m. This will be done by adding varying amounts of distilled water to varying amounts of sucrose solution. Sections of potato will be cut using a cork borer and will be measured and weighed. I measured my potato chip on an electronic weight mass as these would make my readings more accurate. I Made sure that all of my potato chips were 1.68mg and I recorded this on my table as the before experiment weight. This part of the preparation must be done very accurately as a change in the surface area may allow more or less osmosis to occur. The mass of each chip will be measured as well so that more results can be obtained. I will use 25 ml of each concentration of sugar solution and once in the test tubes they each will be labeled. The potato chips will then be placed in the 6 different test tubes and then left for 20 minutes. Then the potato chips will be removed, the surface solution removed using paper towels and then they will be re-weighed. If I then have time afterwards I will repeat this experiment again as to obtain a second set of results. This will hopefully produce more accurate results from which I will be able to draw a more accurate conclusion.
Method
1. I took an average sized ground potatoes and checked that they were both healthy and hard.
2. Using a cork borer I cut out 6 cylinders, and I further weighed and cut them to make them equal in size and weight, on a white tile.
3. Taking a test tube rack I placed 6 test tubes and then labeled them 0 molar, 0.2 molar, 0.4 molar, 0.6 molar, 0.8molar and 1 molar.
4. Using a measuring cylinder I measured out 25ml of each concentration of solution and poured it into the labeled testubes, accordingly.
5. I then weighed every potato chip on an electronic balance and recorded the weights.
6. I swiftly placed a potato chip into each testube and then started my stopwatch.
7. Whilst waiting I set out some paper towels with which I was going to dry the paper and I drew up a basic table for my results.
8. After 20 minutes I drained out the solutions in the sink and placed all the chips on the paper towel in the order I had put them in the test tubes as to not confuse myself as to which chip came from which solution.
9. I dried each chip with the paper towel and then placed each one on the scales so that I could weigh them.
10. Each potato was measured accurately on the electronic scales and then the weights were recorded.
11. As I did not have time after doing the first set of results I was not able to carry out my second experiment.
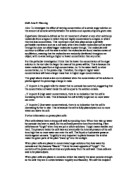
Diagram
Fair testing and precautions
To make sure that my investigation was fair, I made sure that:
- The amount of solution in each test tube was equal
- I used equally weighed potato chips in each boiling tubes
- I used the same sized boiling tubes
- I placed each potato chip inside the boiling tubes for exactly 20 minutes
- The temperature that the investigation was held in was kept at a constant room temperature.
- As was stated in my planning section of the coursework, I had to keep all of the different non-variables the same, to make sure that none of them affected the results of the experiment in any way.
- Whilst cutting the potato, extreme care and precision had to be taken with the scalpel as it is very sharp and could easily cause a serious wound.
- The measurements for the solutions had to be perfect as to not change the out come of the experiment.
- I had to ensure that every time I handled the potatoes my hands were clean and dry. This was to stop any kind of contamination and made sure that I did not pass on any extra water onto the potato
Results
These are the results that I had found after I had done the experiment. Unfortunately, after everyone in our class had done the experiment it was found that no one got very accurate and correct answers, we did not have enough time to redo the practical, so our teacher did the experiment more accurately using the same methods and got improved results. Consequently, I am going to use these results to test my prediction against, as they are more accurate than my results and will allow me to test against my prediction.
Accurate results
Graph
Description and explanation
The graph shown above gives the line of best fit for the percentage change in mass of the potato chips over the course of the 20 minute experiment, in the experimented molar solutions. The graph is a straight line downwards. However, there is a pattern on my graph, and this is, as the concentration of the solution increases, the percentage change in mass decreases. The graph shows that the percentage gain and loss in inversely proportional to the concentration. The gradient does change in my graph. From the line of best fit that has been added in, it can be seen that all of my points were very close to creating a straight line which would have shown that it was proportional. This shows that the results ware fairly reliable. My graph fits in with my prediction of the experiment graph. This graph of the change in mass helps prove the point of complete plasmolysis, whereby the potato cannot expand and take in any more water.
The results show that the mass of the potato chip increased in 0m by 9% and in 0.2m by 4%. This shows that the concentration of the solution outside the potato chip was higher outside the potato chip than it was inside the potato chip, so the higher concentration of solution outside moved into the lower concentration of water inside therefore it increased in its mass. Therefore it fits the prediction that I had made.
At 0.4 molars there was 0% increase in the mass of the potato chip before the experiment and after the experiment was the same mass. The movement of water molecules at this concentration was probably equal in both ways. So there wasn’t a change in mass. This is the concentration that is probably about the same concentration as the concentration of the potato chip. I can conduct a detailed experiment around this molar of solution, in order to find the isotonic point.
At 0.6, 0.8 and 1molar the mass of the potato chip decreased showing that the concentration that these potato chips were kept in had a lower concentration than the potato chips’. So the higher concentration inside the potato chip moved out of the chip more than the amount of water that had come into the potato chip therefore decreasing its mass. This also fits the prediction that I had made earlier.
The graph shows that the mass of the potato chips were decreasing as the concentration of the solution was being diluted. This changed because of the difference of pressure in the inside and the outside of the cells. Where the mass has increased the pressure outside was high so all the water pushed into the low concentration of water inside and where the mass of the potato chip had decreased the pressure outside was lower and so all the high concentration of water inside came outside.
I have drawn a line of best fit were most of the points join together but there are some results that go out of my line of best fit, this could be due to some errors caused in the environment of the concentration of the solution that the potato chips were put in or due to human errors and efficiency.
They could also not be perfect results because we do not exactly know the concentration inside the potato chip. According to my graph the point where the osmosis pressure inside and outside where the same was at around 0.36 molars. We can go into more detail and do the experiment in detail to find out this particular point where the osmosis pressures are the same. . to ensure that I was very accurate while doing the experiment next time, I would use 3 chips in each solution, to create an average result, which will give me a better set of results and more accurate graphs. I will also try to repeat my experiment as it will give me a secondary set of results which give a more accurate view on the changes.
Prediction match
By comparing the results and my prediction I can clearly can say that my prediction was correct. The higher the concentration the higher the mass will increase, the lower the concentration the lower the mass of the cell will decrease. At higher concentration of solution (0m, 0.2m) I found that the mass of my potato chip increased and at lower concentration of the solutions (0.6, 0.8, 1.0m) the mass of my potato chip decreased. At 0.4m the concentration of the solutions was the same so the flow of water molecules was equal. Therefore my prediction was correct!!!
Calculations
I used difference to work out the increase and the decrease in the mass of the chip before and after the experiment so that I could see how osmosis was progressing. The calculations that I did were:
2.45 - 2.67 = 0.22
2.49 - 2.60 =0.11
2.40 - 2.40 =0
2.40 - 2.24 =-0.16
2.41 - 2.14 =-0.27
2.42 - 2.11 =-0.31
I took away the before mass of the chip from the after mass of the chip to see the difference.
I then did calculations to find out percentage differences. I divided the difference of the after mass and before mass of the chip by the before mass and multiplied it by 100 to get the percentage. My equation was:
Difference/Before mass*100=percentage difference
The calculations I did were:
Evaluation
The evidence to this theory is quite accurate as the scientific knowledge that has been researched onto this topic before also says the same theory. The preliminary work that was done by us before also proved that osmosis works in such ways and finally the experiment that my teacher did also proved that if there is a higher concentration of water on the outside of a cell this will move into the cell making it turgid. But if there is a lower concentration of water outside the cell, the water will flow out of the cell making it flaccid. This is proven in the graph of the results as well. As the solution becomes less concentrated the mass of the cells get lower. There were a few points that were of line of best fit, this could be because of the potato chip or the solution that it was put in. The procedures that we used were quite good but it could have been neater, if we tidied some of the details like the excess water around the potato chip and the way the solutions are diluted and the potato chip internal pressures may be different. These can be improved by making sure the excess water is correctly taken off and measures more accurate measures could be used as well.
The time that I used for the experiment to last was enough to allow sufficient osmosis to occur. However if I was to repeat the experiment I will increase the time span of the experiment, to allow more osmosis to happen and possibly find out the saturation point of the chips. The range of concentrations was adequate but I would possibly create more concentrations if I repeated the experiment, so that I would have more varied results, i.e. 0.10m, 1.15m, 1.20m, and so on. This way would have allowed me to also find out the isotonic point.
I was recording my results by mass, it could well have affected the surface area and so the overall rate of osmosis. If I were to repeat the experiment I would have possibly found a machine to cut the potato as it would ensure that all potatoes would be the same weight and dimensions. As well as the potato I could have found a more accurate way to measure out the solutions and to determine the molar concentrations. Perhaps, I could have used a burette. This would ensure that I have an accurate amount of fluid in each test tube. I could also weigh each chip on a more accurate scale, e.g. not to 0.00g but to 0.0000g.
Extend the experiment
To extend the experiment, we can do a detailed one to find out the correct concentration of water in which the internal and external pressure around the cell will be the same, so there will be an equal amount of flow into the cell as there is to the outside of the cell. We could do a detailed experiment on this idea by doing the same experiment that I had done before and then after I have plotted the graph, I should see where about the mass of the potato chip doesn’t decrease. I could then make solutions that are more accurately diluted according to these guides and do my experiment to find out the correct point where osmosis is the same.
Mariya Abdulla
Candidate no: 4001