Investigate the effect of varying the concentration of hydrochloric acid with the rate at which it reacts with calcium carbonate (limestone).
Aim
To investigate the effect of varying the concentration of hydrochloric acid with the rate at which it reacts with calcium carbonate (limestone).
Hypothesis
The more concentrated the solution of the hydrochloric acid the faster the rate of reaction. Also the more dilute the concentration of hydrochloric acid the slower the rate of reaction. We can also predict that by doubling the concentration we can double the rate of reaction.
e.g.
40
Rate of
Reaction
20
Increasing Double
0
20 40
Volume of concentration % (not accurate)
The above graph shows that is my hypothesis is correct what the graph showing the results will look like.
The graph clearly shows that if the volume of concentration increases (or doubles) the rate of reaction will also increase (or double).
Background knowledge
The higher the concentration the faster the reaction is. In order for the limestone and hydrochloric to react:
* They must collide with each other.
* They must collide with energy.
Dilate acid More
Concentration
HCL Particles HCI Particles
Limestone Limestone
Particles can only react if they collide with enough energy for the reaction to take place. This theory is called the Collision Theory.
Increasing the temperature will cause the particles to collide more often with greater collision and move faster. Decreasing the temperature will do the opposite, move the particles slower.
By obtaining research and evidence I will be able to prove in my Background knowledge how my hypothesis is correct.
There are several factors which can affect the reaction rate:
* Surface area
* Adding a catalyst
* Temperature
* Concentration
The reaction formula for the experiment is as follows:
Calcium Hydrochloric Calcium Carbon Water
Carbonate Acid Chloride Dioxide
+ + +
Ca Co3 (s) 2 Hcl (aq) CaCl2 (aq) Co2 (g) H20 (1)
In the reaction it is the Carbon Dioxide we shall be collecting and using to measure the rate of reaction. The more Carbon Dioxide produced will show the faster the rate of reaction.
I will now show how each of the factors can affect the rate of reaction.
Surface area theory
The surface area greatly affects the rate of reaction for any type of reaction between any chemicals.
The greater the surface area, the faster the rate of reactions. This theory has been obtained by the fact that the area of the particles has increased, therefore provides more space for the hydrochloric acid and calcium carbonate to react. There for, powered calcium carbonate would, react much faster than big lumps because the powder has a greater surface area and more surfaces for the hydrochloric acid to react with. As shown on the next page:
= Shows surface area available
A limited number of surfaces available from a large lump of calcium carbonate. If lumps this size were used to hydrochloric acid would have less surfaces to react with.
A various number of surface area available from the same lump of calcium it's just cut up into smaller pieces.
If powder was used, there are more surfaces for the acid to react with.
Adding a catalyst
Adding catalyst is also an aspect that helps the reaction rate to increase.
Catalyst can be found in a variety of everyday things such as vegetables, liver, chemicals, and metals.
Most catalysts have an enzyme called catalase which helps to speed up reaction rates.
As in a previous experiment, the Enzyme catalase was very efficient in speeding up the rate at which hydrogen peroxide decomposes. There are a number of ways enzymes can be used as shown:
Enzymes
Hydrogen Peroxide decomposes very
Hydrogen slowly into water and oxygen.
Peroxide
Solution
Bubbles Manganese 6 oxide speeds up
Maganase of the reaction making it thousand
6 oxide oxygen of times faster.
Froth Raw liver also speeds the
Liquid froths as oxygen bubbles
Raw off.
Liver
Cooked If you boil the liver, it no longer
Liver speed up the reaction.
We also need to understand how enzymes actually speed up reactions.
How Enzymes Work
Enzymes Reactant
Molecule Molecule
First the molecules fit together like
jigsaw pieces. For this the reactant
molecule has to be the right shape.
Reactant molecule
Breaking down.
The complex that forms makes it
easier for the reacting molecules to
break down. When decomposition is
complete...
... The product molecules break
away. Another molecule of
reactant will take their place
as long as its shape is right.
Enzymes are different from catalysts ...
This is a preview of the whole essay
Enzymes Reactant
Molecule Molecule
First the molecules fit together like
jigsaw pieces. For this the reactant
molecule has to be the right shape.
Reactant molecule
Breaking down.
The complex that forms makes it
easier for the reacting molecules to
break down. When decomposition is
complete...
... The product molecules break
away. Another molecule of
reactant will take their place
as long as its shape is right.
Enzymes are different from catalysts in the following ways:
* The specific shape of the molecule is very important; it is because of the specific shape of the molecule, that enzymes will only catalase a specific reaction.
* Temperature about 45°C will denature enzymes.
* Enzymes also become denatured by mixing with alkalis and acids.
Catalyst also lower the energy needed for a reaction to occur. This helps the reaction rate to increase.
Temperature
Temperature also affects the rate of reaction. If you were to heat the temperature of the acid, the greater the temperature is increased the greater energy the particles. The number of particles does not change, just the amount of energy the particles contain.
20°C 40°C
Reaction rate at 20°C, little Reaction rate at 40°C, lots of
energy in the particles less energy in the particles more
chances of collision. Chance of collision.
The more collisions that occur in a reaction the faster the rate of reaction. Therefore the more energy a particle has the more chance it has of colliding and causing a reaction. The higher the temperature the faster the rate of the reaction.
Concentration/collision theory
Concentration is the main part of the investigation, as the investigation is based around the concentration of the solution.
A more concentrated solution of hydrochloric acid just means that there are more hydrochloric acid particles present. A reaction will only occur if there is a collision between the hydrochloric acid particles and the calcium carbonate particles (limestone).
As the concentration is increased we also increase the number of hydrochloric acid particles, which means we have increased the chance of a collision between the calcium carbonate and the hydrochloric acid.
High concentrated Low concentrated
Hydrochloric acid Hydrochloric acid
A previous experiment was done which was very similar, this involved using sodium thiosulphate, and hydrochloric acid and then timed to see how long it would it take for the cross to disappear. The results are shown below:
Volume of Sodium
Thiosulphate solution
Volume of Water
Time taken for cross
To disappear
50cm
0cm
28s
40cm
0cm
35s
30cm
20cm
45s
20cm
30cm
76s
0cm
40cm
73s
The results show that the greater the concentration of sodium thiosulphate, the faster the cross disappears meaning the faster the reaction.
My prediction
I think that if you increase the concentration, the reaction will be faster. If I double the concentration the rate will double.
1 mole 2 moles
Per DM3 Per DM3
Increasing the concentration of the acid causes more hydrogen to be formed.
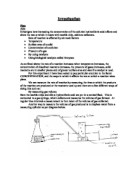
Plan - Equipment/apparatus
Measuring Cylinder (x2)
Bowl
Beaker
Rubber Tube
And Bung
Distilled Water
(H20)
Small sized
Calcium carbonate chips
Stop
Watch
Weight measurer
(Electronic)
Test Tube
Holder Conical Flask
(H202)
The equipment shown on the following page will be used as the following:
BOWL - This will be filled with water to help measure the amount of Carbon Dioxide released.
MEASURING CYLINDERS(X2) - These will help to measure the concentration solutions (HCL and H20). The second cylinder will be used to measure the amount of Carbon Dioxide released.
DELIVERY TUBE & RUBBER BUNG - Will carry the Carbon Dioxide from the beater to the measuring cylinder to be measured.
BEAKER - This is where the different concentration will be held.
CONICLE FLASK - This will hold the hydrochloric acid and will be contained in a brown glass stained bottle to prevent the sun altering the hydrochloric acids properties.
ELECTRONIC WEIGHT MEASURER - This will be used to ensure the same amount of calcium carbonate chips will be used.
TEST TUBE HOLDER - To hold the test tube.
DISTILLED WATER - to ensure impurities in normal water don't affect the reaction we use used distill water, to make the different concentration.
* The test tube will be placed in the test tube holder.
* The bowl will be filled with water, with a cylinder also filled with water which will be placed in the middle of the bowl.
* The calcium carbonates chips will be weighed to approximately the same weight.
* The different amounts of concentration will be pressured using a cylinder and placed in the beaker.
* The calcium carbonate chips will be placed in the beaker.
* The concentration solution will then be added to the test tube.
* Immediately after that the rubber bung will be placed in the test tube and end of the delivery tube will be placed in the bowl inside the cylinder.
* The amount of carbon dioxide released will be noted at different intervals of times.
My Method
Measuring Stop Watch
Cylinder Hydrochloric
Acid (HCL)
Beaker Containing
different
Delivery concentration
Tube Bung
Test Tube
holder
Bowl
Calcium Carbonate
Water (CaC03) HCL H20
The equipment will be set up as shown above. There will be five different set of concentration. There will be two sets of results to ensure accuracy; an average will be worked out.
The concentration solution should be added to the test tube containing the calcium chips. Immediately the bung will be placed in the test tube. As carbon dioxide is released, the water in the measuring cylinder should decrease.
This process shall be carried out another four times using the different concentrations. The experiment will then be corned out again for a second set of results from there a table can be worked out to show the average.
To achieve a good range of results, we had to choose an appropriate interval for time. To close, and the results will be too similar. Too wide and the results won't be accurate enough.
Fair test
To ensure the experiment was fair the following requirements were made:
* The temperature of the solution should be kept constant. To avoid changes in temperature, the experiment was carried out away from the heaters.
* The surface areas of calcium carbonate (limestone) chips were kept roughly the same size.
* The weights of the chips were measured to be roughly about the same weight.
* The same equipments were used for every experiment done. All aspects were kept the same apart from concentration.
* The time which the reaction was measured was kept the same.
Safety
To ensure that the experiment was conducted in a safe manner the following observations were made.
* Safety goggles were worn at all times throughout the experiment, to avoid any contact with hydrochloric acid and eyes.
* The poring of hydrochloric acid was done at arms length away from the body. It was also done below the eyelevel.
* As there was a lot of water during the experiment paper towels were kept near by in case of an emergency.
Results
Fig 1 - Table to show how concentration was made.
Concentration (%)
Hydrochloric Acid
(HCL)
Distilled Water (H2O)9
00
20 ml
0ml
80
6ml
4ml
60
2ml
8ml
40
8ml
2ml
20
4ml
6ml
Fig 2 - Table to show first set of results.
Concentration
(%)
Volume Of Carbon Dioxide produced in ml per time/s
0 20 40 60 80 100
00
0
52
90
30
40
81
80
0
30
62
81
02
28
60
0
20
42
60
90
90
40
0
0
24
41
49
52
20
0
4
2
0
32
21
Fig 3 - Table to show second set of results.
Concentration of HCL (%)
Volume Of Carbon Dioxide produced in ml per time/s
0 20 40 60 80 100
00
0
51
89
29
41
80
80
0
30
63
80
01
29
60
0
20
41
60
88
90
40
0
0
24
41
50
51
20
0
5
1
1
31
20
Fig 4 - Table to show Average set of results
Concentration of HCL (%)
Volume Of Carbon Dioxide produced in ml per time/s
0 20 40 60 80 100
00
0
51
89
29
41
80
80
0
30
63
80
01
29
60
0
20
41
60
88
90
40
0
0
24
41
50
51
20
0
5
1
1
31
20
Calculating Average Readings
The readings found on fig 4 shows my average set of results for the experiment.
My readings were worked out by adding together, my results from previous results tables (fig2 + fig 3) and dividing the number by 2.
E.g. The average for 100% concentration
Results
C03 after 20 sec
C03 after 40 sec
C03 after 60 sec
C03 after 80 sec
C03 after 100 sec
st set (fig 2)
52
90
30
40
81
2nd set (fig 3)
51
89
29
42
80
The readings are already similar, but to get exact and accurate result I must find the average. I can do this by doing the following:
Co3 after 20 sec
Co3 after 40 sec
Co3 after 60 sec
Co3 after 80 sec
Co3 after 100 sec
Add 1st + 2nd set
52 + 51
90 + 89
30 + 129
40 + 142
81 + 180
Divide by 2
= 103*2 =51.5
= 179*2
=81.5
=259*2
=129
=282
=141
=361
=180.5
Average
=59
=89
=129
=141
=180
This enabled me to work out the average of all the other concentrations.
Analysis
By looking at my results, I can tell that the more concentrated the solution of hydrochloric acid the faster the rate of reaction. This is because with a concentrated solution more particles are present and so there is an increased chance of collision. The rate of the reaction increases releasing more carbon dioxide.
My results seem fairly accurate but not exactly. These are shown in the table:
Concentration
Time/sec
C02 after 20sec
CO2 after 40 sec
00%
0
54 50
90 100
80%
0
30 30
62 60
These results show slightly odd results due to equipment used or faults made while doing the experiment which are also listed in my improvements. Such as inaccurate measurements of the concentration could be a justification to my inaccurate results.
The above figures also show that roughly a pattern/trend exists. This is that as time doubled so did the amount of carbon dioxide being released.
My results are reliable enough to come up with a conclusion this is because my actual results table are similar to my predicted quantities graphs.
My results show the basic principle that if concentration increases so does the amount of carbon dioxide. This is predicted in my quantities graph.
Quantities Graph
Amount
C02 20
Produced
(cm3)
10
20 40 (not accurate)
Volume of Concentration (%)
The collision/concentration theory demonstrated in my knowledge backs up my results. The collision/concentration theory states: A more concentrated solution of hydrochloric acid just means that there are more hydrochloric acid particles present. A reaction will only occur if there is a collision between the hydrochloric acid particles and the calcium carbonates particles. As the concentration is increased we also increase the number of hydrochloric particles, which means we have increased the chance of collision between the calcium carbonate and the hydrochloric acid.
E.g.
High Concentration Low Concentration
This backs up my results as the quantities graphs are similar to my actual results as I predicted.
My results are accurate to come up with a conclusion.
Conclusion
At the beginning of my investigation I predicted that by doubling the concentration of hydrochloric acid the reaction rate will double.
My method shows how of calcium carbonate was added to the solution causing bubbles releasing carbonate dioxide to be produced.
My results seem to be fairly accurate but not exactly. (As shown on the analysis)
There odd results were probably due to equipment used or faults listed in my improvements such as the reliability of equipment and maintaining other factors constant. (Such as temperature)
My method of using an upside down measuring cylinder was not a good method of carrying out this experiment. As by making sure the measuring cylinder was completely filled, was tricky as in the process mistakes were made.
An alternative method of using measuring cylinder can be to use a gas syringe. These are more reliable and directly measure the amount of carbon dioxide being released with out the interference of the water.
Any odd results which I may have had are due to either human error, or faulty equipment or the method I used.
My results seem really good enough because they show the basic principle I predicted (As shown on the quantities graph) can be shown through a certain extent in my results.
My results may not be exactly correct; however they are enough to come to a conclusion too. Also, my quantities graph shown in my Hypothesis, shows that the line graphs is very similar to the graphs to my results. The collision theory backs up my results.
Improvements
If I were to do my investigation again, the following improvements would be made:
* The use of a gas syringe would have ensured that the gas bring released was measured accurately. (although my method worked, a gas would have given extremely precise and reliable results)
* To solve the problem of human error, I could have used colleges to help assist me with the experiment to ensure minimum error.
* I could have noted down the temperature of the room to ensure it was in a controlled environment and so the temperature did not affect my results in any way.
* My experiments were done during different days as there would not be enough time in one day. This may have affected my performance or the results.
* Not all the equipments were used again for each experiment, due to the fact it had to be handed in and done on a different day and would have caused confusion.
* Different type of equipment could have been used such as gas syringe instead of an upside down measuring cylinder.
Extended investigation
If I were to extend my investigation further, I would do the following:
* Do both concentration and temperature - This is so the results won't be influenced by varying temperature due to natural surrounding, but controlled at precise temperature. Also to see if there is a relationship between the too.
* Use a computer programmed suitable for reading results and come up with results and links to relationships.
* Use a variety of different sized chips of calcium carbonate.
* Use a wide range of results.
Bibliography
My research was gathered from various sources listed below:
G.C.S.E SCIENCE CLASSBOOK = By David Baylis
Graham Booth
Bob Mc Duell
THE SIENCE CO-ORDINATION GROUP REVISION
GUIDE FOR G.C.S.E SIENCE = By Richard Parsons
INTERNET = AOL - REWISEWISE
G.C.S.E BITESIZE
Evaluation
My method for this experiment was not as reliable as I had expected. This was due to the way the readings were measured, by my method of using an upside down measuring cylinder. I should have changed my method by using a gas syringe instead
Gas Syringe
Beaker
Hydrochloric Acid
Calcium Carbonate chip
Concentration
My results have been slightly affected by my method. Although most of my results were reliable although there were some that were not. These are shown by me graphs as some readings are not apart of my lines of best fit. Some of these are also either too high or too low and cannot follow my prediction.
My inaccurate results could have been caused by impurities in the water, although I did try to use distilled water.
They also could have been caused by the way my hydrochloric acid was measured as I used a measuring cylinder. This could have been improved by using a burette. This is because burette is a more accurate piece of apparatus than a measuring cylinder is at measuring liquid.
A more accurate scale could have been used to measure my calcium carbonate chips. As the one I did use did not weigh to decimal places but rounded off to the nearest gram.
I also took a wide range of readings and worked out averages.
My accurate results are proven correct as they match my quantities
graphs and my prediction.
Overall my experiment worked out fairly well as my experiment results were reliable enough to support my predictions. This is shown by my graphs as they are reasonably similar to my quantities graphs.
In order to extend this to work I could have carried out the same experiment but also monitored the temperature of the concentration.
I maintained all other factors which may have influenced my results. Such as temperature, surface area, and the use of catalyst.
However to extend this experiment it would be interesting to redo the experiment using another factor also.
On the whole I would consider my experiment accurate enough to draw a conclusion, although not precisely accurate enough to reveal accurate patterns and similarities and there are number of reasons to why this may have been.
Although I could have had my concentrations of hydrochloric acid solution go up units of 10 instead of units of 20, also I should take more readings and averages. This would have made it easier to spot patterns or changes in my results.