Thiosulphate acid chloride dioxide
Na 2 S 2 O 3 (aq) + 2HCl (aq) → NaCl (s) + S2 (s) + SO2 (g) + H2O (l)
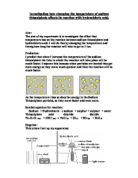
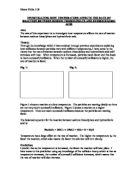
Diagram:
This is how I set up my apparatus:
Method:
This is the way I set out my experiment:
I set up my experiment using the diagram.
I measure out the chemicals using measuring cylinders because they are more accurate then a beaker and I made sure I read it out at eye level.
I added the chemicals at the same time to the conical flask and started the stop clock.
I timed how long it took before the level dropped at a steady value.
I repeated the experiment three times to give me more reliable results. I did the experiment using five different temperatures. The temperatures that I chose were , 5°C, 25 °C, 35 °C, 45 °C, and 55 °C. I chose these because they show a range of temperature and the intervals between them is the same mostly.
Fair test:
In this experiment the variable is the temperature since it is the only one that changes.
Accuracy:
To make my experiment accurate I measured all the certain liquid in a measuring cylinder and then looked at it and made sure I read it at eye level.
I made sure that I did the experiment exactly the same way each time I repeated it.
I also made sure that I double-checked any unusual (anomalous) readings.
After each experiment I thoughly washed the conical flask and the measuring cylinders so there was no trace of the past experiment to react with the one I am currently doing.
I repeated the experiment three times to find the mean (average) results.
Safety:
To make my experiment safe so that neither myself nor anyone else in the laboratory was hurt I…
Wore safety glasses and an apron,
Used all the equipment carefully,
Tried not to spill of the chemicals.
Results:
The results of my experiment are shown in the table below.
I have plotted the mean results as a line graph with a line of best fit.
Conclusion:
My results support my prediction; in my prediction I said that I thought that the hotter the temperature the quicker the reaction will be and in my results I found the same sort of thing. The shape of the graph starts high and then decreases as the temperature of the sodium thiosulphate increases the time taken for the reaction decreases. I think that I got these results because the higher the temperature is the quicker the reaction. This is because when the particles in the sodium thiosulphate get hot they get more energy so they move more, which sped up the reaction.
Evaluation:
I think the experiment that I done went very well. All of the results I got were as I expected. The results I got were quite accurate for when I repeated the experiment. The results I got were similar to most of the other students in my class. The points on the graph I done was close to the best-fit line and there were no strange results.
I think the method I used was good. I think that the good things about it were that the experiment was set out good and that the liquids were measured very accurately. If i was to do my experiment again I will increase the concentration of the hydrochloric acid.
By Shahid Ali Parvez. Chemistry 10.5/A