Method
Note: We are performing this experiment in pairs.
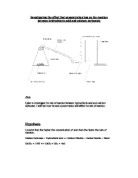
Firstly, I am going to set up my apparatus like the diagram below:
Next, one person will measure out 5g of small marble chips on a scale accurate to 0.01g. Meanwhile, the other person will measure out a 20cm3 solution with the measuring cylinders accurate to 0.2cm3, preparing solutions of different concentrations ranging from 0.5M to 2M. The measuring cylinder accurate to 1cm3 will be filled to the brim with water, before being submerged in the pneumatic trough, being fixed vertically and held in place by the stand’s claw. The tubing of the conical flask will be squeezed fully, to get rid of any air or water already inside, before feeding it underwater into the measuring cylinder. After checking that the apparatus is correctly set up, and that we are wearing safety goggles, we will put the chips into the conical flask. One person will then take the acid and pour it in, also fixing the bung, whilst the other starts the stopwatch. We shall then watch as the water level in the measuring cylinder drops, due to the CO2 being produced pumping into it. When 50cm3 of water has been replaced, we shall stop the stopwatch, and record the results.
This experiment is being performed in the same room, so the conditions should not alter too much, although room temperature may alter. Variables such as amount of CaCO3 being used is being kept constant – 5g used for each reaction. Also, the amount of solution is being kept to 20cm3, so erroneous results cannot be obtained for that reason. We will be using the same equipment and same method throughout – the same set of scales and stopwatches will be used, so the same degree of accuracy is used.
I shall trial this method, and make suitable changes if needed. Then, I shall perform this experiment twice more, using those two experiments’ readings to gain an average rate of reaction.
Variables
My independent variable for this experiment is the concentration of the HCl solution. My dependent variable for this experiment is the time taken for 50cm3 of water to be replaced by CO2. My controls for this experiment are the amount of marble chips used, the amount of solution used and the accuracy of the measuring devices.
Safety
There are a number of safety issues involved with this experiment. First, we are using HCl. This has a pH level of 1, so it is very corrosive – especially on skin. Thus, we shall be very careful when handling it. For this reason, we shall be working in an open space, and not be bunched up on a table – we should not be nudged or knocked, all but eliminating the possibility of an accidental spill. If there was a spill, all books and objects that could be damaged by the acid will not be affected, as we will move them out of harm’s way.
We shall be wearing safety goggles throughout this experiment, so any spillage will not come into contact with my eyes. I shall wash my hands after handling HCl, as I cannot then harm myself if I were to rub my eye or face with my hands. As I will be using a glass conical flask, I should be careful not to knock it hard or break it. If I do, I shall alert my teacher immediately, so it can be cleaned up. With a conical flask, the large, flattish base should provide stability, so I will not need to hold it steady.
Predictions
I predict that:
-
As the concentration gets higher/stronger, the water level will drop faster. This will be due to more CO2 being produced at a faster rate. For example, if we double the concentration from 1M to 2M, the water level should drop around twice as fast.
-
As the concentration gets lower/weaker, the water level will drop slower. This is due to less CO2 being produced at a slower rate, e.g. as we halve the concentration from 1M to 0.5M, the water level should drop around twice as slow.
-
The higher/stronger the concentration, the larger the rate of reaction will be, due to there being more reactive particles to collide frequently and faster with. Thus, CO2 will be produced faster and in greater quantities. Hence, the time for all the water to escape will be quicker. For instance, if we doubled the concentration from 1M to 2M, the reaction rate should also be doubled.
-
The lower/weaker the concentration, the smaller the rate of reaction will be, due to there being less reactive particles to collide frequently and faster with. Thus, CO2 will be produced slower and in lesser quantities. Hence, the time for all the water to escape will be slower. We could predict that, as we halve the concentration, the reaction rate will be halved.
Trial Experiment
Results
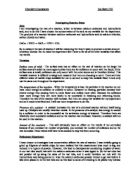
As we can see, we started with 5g of Calcium Carbonate, but the reaction times were very quick with the 2M solution. So, we changed the amount of CaCO3 used to 1g, which steadied the results. My results here match my predictions, in that the stronger the concentration, the faster the reaction went.
Actual Experiment
Attempt 1:
Attempt 2:
Analysis and Conclusions
From the tables above, we can see that the results mainly fit my predictions, i.e. as the concentration gets greater, the rate of reaction increases, and that as the concentration gets weaker, the rate of reaction decreases. My numerical predictions are very near – although the rates and times taken are not precisely true, they are close. We can see my results on the graph below:
As we can see from the graph, the results are very different. One graph shows a straight line through the origin, suggesting concentration and rate of reaction are directly proportional. However, the second experiment shows a curve that passes nowhere near the origin, suggesting concentration and rate of reaction aren’t directly proportional. Each graphs shows that, as the concentration increases, the rate of reaction increases - for each attempt, we can see an upward trend with the results. However, the curves do support my predictions. There are parts on the graph where the curve is very steep- suggesting that with a small increase in concentration, the rate of reaction rises dramatically; thus we can say, excluding the anomalies, my results are reliable.
In the weaker concentrated solutions (0.5M – 1M), we can see a slower rate of reaction. This is because of the fact there is less HCl particles than water particles. For this reason, the solution is less reactive. This means that, when calcium carbonate chips are placed into the solution, there are less of the more reactive particles to collide with, thus collisions that have enough force to react occur less frequently. Take for example the 0M solution. If we add pure distilled water to the CaCO3, nothing would happen, so the reaction would be 0.
In the more concentrated solutions (1.5M – 2M), we can see a faster rate of reaction. This is because of the fact there is more HCl particles than water particles. For this reason, the solution is more reactive. When calcium carbonate chips are placed into the solution, there are more of the more reactive particles to collide with, thus collisions that have enough force to react occur more frequently, and with more force, so the reaction occurs faster. With our results, we can see that the 2M shows this – the reaction went the fastest, as we were putting the calcium carbonate chips into pure HCl.
Evaluation
I think this experiment varied in success. Whilst my pair repeated the experiment, we only obtained one result for 0.5M, and other results had anomalies. These anomalies are bracketed in the results tables. With my trial experiment, I only took three readings, so I could not fully tell if my method was successful until I took further readings.
For the best part, though, our results are reliable. We repeated the investigation twice, except for one experiment, so the majority can be considered reliable. My predictions and results complement each other, but there are cases when the numerical predictions aren’t met. If we were to replicate the experiment, we would make sure we allowed time for repeating.
My anomalies are circled on the graph, and bracketed in the results table. There are possible reasons for these anomalies. Firstly, with our method, we had to be quick in starting the stopwatch, and timing it exactly with the solution being tipped in. Had this been done slightly before or after, the results may have been affected. However, this would only be a slight misjudgement, so my results would not have been affected that much.
Perhaps the most striking reason for an anomalous result may be due to the fact solutions were mixed together before the experiment started. We measured out the distilled water and the HCl separately, but then put them together to check we had a 20cm3 solution. Although this was clever, and allowed us to see if we measured accurately, there may have been a chance for the solution to dilute. Thus, the concentration may not have been what we wanted, and hence the results would have been affected.
The two sets of results are very different – this is shown by the curve and the straight line on the graph. A possible explanation for this is that the two sets were obtained on two separate days – the second performed a week after the first. Thus, the room temperature may have been different. For this reason, if we were to further this work, I would make sure the conical flask was placed into a water bath, so that the conditions for the reaction were the same, thus making it a fairer experiment. This would help us obtain more reliable results.
Also, due to the experiment being performed on consecutive Wednesdays, the technicians may have prepared the solution differently. Thus, there may have been an error in the makeup of the solution, and so it may have not been pure 2M HCl we were working with. However, as the technicians have more accurate measuring equipment than we did, this may not be the case.
I cannot fully tell which experiment was performed better – each has anomalies, and due to the differing curves on a graph, I cannot tell which is right. Thus, I would have to repeat the experiment a few more times before coming to a conclusion about the best set of results.
An improvement to my experiment could be that next time, I could use a gas syringe. We used a measuring cylinder to collect the CO2 for this experiment, and so we had to clamp it into place in the water. Whilst this was a very good way of measuring, it posed a problem. The measuring cylinder may not have been at a totally vertical angle, and so a slanted reading may have appeared. To expel this problem, the gas syringe would have its plunger parallel to the main part, so a slant would not be a problem.
If we were to further this experiment, we could react the CaCO3 chips with different acids, such as nitric or sulphuric acid. We could then compare those results with this investigation, and see what acid is the most effective in corroding CaCO3 chips. We know from the results that, as concentration of HCl solution increases, as does the rate of reaction. To see if this applies to most acids, we shall have to investigate them.
I do feel, however, that my results complement my conclusions, and so for this reason, my results have to be partly reliable. I feel the accuracy we measured our results to be very good, and very successful. So if we were to repeat, I would alter parts of my method with the suggestions already stated.