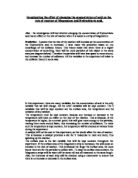
Moles calculations
Mg + H2SO4 MgSO4 + H2
Mole ratio 1 : 1 : 1 : 1
Info 100cm3 of H2
Moles = 100 = 0.00417
24000
We use mole ratio 1:1; therefore we need 0.00416 moles of Mg
Answer = 0.00416 x 24 = 0.10g of Mg (2s.f.)
Mg + H2SO4 MgSO4 + H2
Mole ratio 1 : 1 : 1 : 1
Info 100cm3 of H2
Moles = 100 = 0.00417 of H2
24000
We use mole ratio 1:1; therefore we need 0.00417 moles of H2SO4
Answer = 0.00416 x 1000 = 10.4 cm3 of H2SO4
0.4
Therefore, to make sure that the H2SO4 is in excess, I will use 20cm3 of sulphuric acid.
N.B. I used 0.4 molar of sulphuric acid in my moles calculation because it is the smallest molar of H2SO4 that I will use in my investigation.
The above calculation shows that 10.4 dm3 is the minimum amount I need to obtain 100cm3 from 0.10 grams of magnesium.
Variables:
As in most scientific experiments, variables have to be found and then controlled in order for the investigator to be able to compare results accurately and form reliable conclusions. The independent variable here is the concentration of the H2SO4 and the dependent variable is the volume of H2 given off and the time it takes the reaction to give off 100cm3 of H2SO4 the following are the variables I will have to control and keep constant:
-
The Temperature. This variable will make a difference to the reliability of the experiment as an increase in temperature would cause the molecules to collide harder and faster increasing the rate of a reaction and if this were to take place the rate of reaction change which I would be measuring would not be due to just the change in concentration of the H2SO4 when what is desired is that any change in the rate of reaction is due to the change in concentration of the reactant H2SO4. The temperature could also decrease causing the particles to move slower and not collide as hard reducing the rate of reaction again causing the change in the rate of reaction not being fully due to the change in concentration of the H2SO4 when what is desired is that any change in the rate of reaction is due to the change in concentration of the reactant H2SO4. There is not much which can be done in order to control this variable, the best that could be done is try and obtain all the results on the same day and in one go during a certain time of the day. If this were to be done then there would be very little variation, if any in the temperature as the temperature does not vary too much in one day during a certain time of the day, maximum variation would be +-1.5 degrees centigrade.
-
The Apparatus. The apparatus used must be the same throughout the experiment, this will be because some apparatus will behave differently to other apparatus, for example, some rubber bungs may leak more air than others, if two different bungs which leaked different volumes of air were to be used for different runs of the experiment then the results would be incomparable. Therefore the apparatus I start with will be marked in order to make sure no apparatus which I am using is misplaced.
-
Friction In Gas Syringe. The friction of the gas syringe must remain constant; whether this takes place or not depends largely on its quality of manufacturing. If there is suddenly much more friction in the gas syringe, the results will be less then they should and if there is suddenly less friction the results will be just slightly higher than they should as the gas syringe may carry on sliding for a certain length without any H2 pushing it. To prevent this as best we can, the same gas syringe will be used throughout the experiment and it is unlikely that suddenly the gas syringe’s friction will change over one investigation. To avoid the gas syringe I am using changing I will mark it so that if it is misplaced it is recoverable.
-
Human Error. This is not much of a variable but, if the experiment is being done when the person taking the results is tired there is likely to be more human error than when that person takes a set of results when he or she is normal. However, there will, as in all experiments be some human error in this experiment. There is not much which can be done to prevent this, but to try and cut down on this, a lot of care will be taken throughout the investigation, and the experiment will not be done when I am tired (I will try and do it all in one go).
-
Accuracy Of The Weighing Balance. This again is not much of a variable (the actual variable here is the different amounts of error) but this has to be taken into account somewhere because the solution for this will help preventing errors. The weighing scales are only accurate to two decimal places, and therefore can be inaccurate up to approximately 4-5%. This cannot really be prevented unless larger masses of Mg are used which will be tried but just to keep the inaccuracy constant the same weighing balance will be used.
-
Overall Volume of Solution Used. In order to achieve the aim of the experiment, which is to investigate the effect of different concentrations of Hydrochloric acid (H2SO4) on the rate of reaction between Hydrochloric acid (H2SO4) and limestone (Mg), the total volume of solution must remain constant as varying total volume of solution could result in the results of different concentrations to be incomparable. I will therefore keep the total volume of the solution constant at 25cm3.
-
Surface Area of Magnesium strips. This variable is likely to cause the most inaccuracy in this investigation. It will take a long time to try and cut all the marble Strips so that they have a constant surface area and even then there would be quite a high variation so I will not do this, additionally taking the time in cutting the Strips could result in the experiment having to be carried on to another day causing other variables such as temperature to be more vulnerable to variation (this would be an example of the law of diminishing return). However it is quite obvious that as the surface area of the Mg increases the rate of reaction increases because there is a higher chance of a collision and therefore a successful collision and if the surface area of the Mg decreases the rate of reaction decreases, there is a lower chance of a collision and therefore a successful collision and this then results in the rate of reaction being decreased which will make the results inaccurate. However probability in theory would show that it is likely that the number of times which I get a surface area which is quite large and the number of times I get a surface area which is quite small is likely to be even and therefore they should cancel each other out; however, this is not always the case. The best way I could try and control this variable would be by looking at the magnesium strips and trying to judge whether they are roughly the same despite the huge inaccuracy this has.
-
Mass of Mg stripss. The mass of the magnesium strips used to react the H2SO4 with must be constant as this would affect the rate of reaction as the mass of magnesium strips would quite obviously directly affect the surface area of the magnesium strips causing the reaction to have other factors affecting the rate of reaction which is undesired and will make the results incomparable. For this reason the mass of marble chips will be kept constant at three grams.
Timing of Readings. The timings of the readings taken on the volume of H2 produced in the reaction must be kept constant as this would make the results hard to compare, not necessarily incomparable because the volume of H2 can still be worked out, however it would have to be worked out on averages of the volume of H2 being given off per second rather than readings being taken at the exact moment, making the experiment just a little bit unreliable. I will therefore measure the volume of H2 given off every 5 seconds for 90 seconds.
Method & Apparatus:
Apparatus
- Gas Syringe *1
- Conical flask *10
- Rubber Bung *1
-
Beakers (250cm3 and 50cm3) *1
- Magnesium Strips (Mg)
-
Sulphuric Acid (H2SO4) exact concentrations on table below.
- Stop watch *1
- Top pan balance *1
- Pencil *1
- Paper *1
- Ruler *1
- Small Plastic beaker *10
- Delivery Tube *1
-
Burette 50.0 cm3
- Marker pen *1
Table of Dilutions
Risk Assessment:
As in all scientific experiments, risks have to be observed and then controlled, or at least minimised. In order to make this experiment as safe as possible, safety goggles will be worn and a lab coat will also be worn in case any explosions take place and it will make it harder for substances to enter or come in contact with the skin. This is because acid is corrosive and can harm skin if it is used irresponsibly. Magnesium and Sulphuric acid is not dangerous unless it is eaten or drunk in a reasonable amount so the risk here is low. When handling some of the apparatus extra care will be taken, as they are delicate and expensive, such as the gas syringe. Additionally if the gas syringe or any other glass object is dropped the glass can be dangerous so if this does take place a member of staff will be informed immediately.
There are no poisonous substances being given off in this experiment, there will be a gas given off, Hydrogen (H2). My pre investigation practical will enable me to observe and consider whether any more safety precautions will be needed.
Pre Investigation Practical:
A pre investigation was carried out in order to make sure the experiment was practical, accurate, safe, and it gave me the opportunity to practice controlling the variables. I did not observe any major safety hazards and the experiment seem to run smoothly. However there was a slight difficulty and this was that once the H2 volume given off had crossed 100cm3 if the bung was not removed the delivery tube’s bung would burst off; this could a hit a person’s eye. In order to control this as soon as the volume of H2 given off in the actual experiment reaches 100cm3 the bung will be detached. In order to obtain results which will be as accurate as possible in the actual experiment I performed the experiment with two or three different gas syringes and observed which one had the least changes in friction as sudden changes in friction would bring unreliability in data obtained. The gas syringe that seemed to have the least changes in friction was marked and will be used for the actual experiment. The results below are those from the pre investigation practical. However another difficulty was encountered with the gas syringe and this was that it would not go back down exactly to zero, it would not go back further than 1-2cm3 most of the time, in order to make sure this did not make a difference to the results in the pre investigation practical and to make sure that this does not affect the obtaining of accurate results in the actual experiment the reading which the gas syringe would not go back further than was subtracted from the results so that the results illustrated are only the displacement due to H2 being produced by the reactants. Another variable which I found needed to be controlled would be the number of times the conical flask would be shaken in order to make the magnesium come in contact with the H2SO4, variation in this would cause the rates of reactions to be affected as by shaking the conical flask the kinetic energy and the movement of the particles increases causing a collision and successful collision to be more probable and therefore a increase in the rate of reaction (and visa versa), I therefore set the number of shakes to be twice.
Obtaining Evidence
Method:
The method described in the planning experimental procedures stage was carried out along with the modifications made once the pre investigation practical had taken place, however some problems were still encountered. The gas syringe jumped slightly towards the end of the experiment, this was a result of the friction changing in the gas syringe. This probably did not happen suddenly but was gradually happening during the experiment and only became noticeable towards the end. Apart from these no other major problems were encountered. I checked the weighing balance had been set at zero and the gas syringe was set at zero when possible or the air inside was subtracted from the result in order to make the results comparable.
The safety precautions which I was planning on taking from the planning experimental procedures stage were carried out and the extra safety measure mentioned in the pre investigation practical (removing the bung from the gas syringe as soon as the volume of H2 produced crossed 100cm3 to prevent the bung from bursting off) was taken, extra care was taken in making sure the bung was securely and tightly placed back into the gas syringe in order to make sure no leakages took place which would make the results unreliable. No glass was broken or H2SO4 and Magnesium spilt or eaten or drunk and there were no explosions showing that the experiment was carried out carefully and safely.
I controlled the variables as I said in the control of variables in the planning experimental procedures stage and I controlled the variable I found during the pre investigation practical as I described I would control it in the pre investigation practical. Controlling all of the variables went to plan except from controlling the surface area variable of the magnesium. I found it extremely difficult to try and judge the surface area and to try and keep it similar, especially as the experiment went on and every sample was compared to the previous sample, this could have resulted in each sample having just a slightly lower or higher surface area which would make the difference between the surface area between the first sample and the final sample to be relatively large, however the probability of this is low. Apart from this variable all other variables were controlled as said in the controlling variables section.
I weighed out the masses of the Magnesium using a top pan balance and I calculated the exact inaccuracy caused by the weighing balance and it turned out to be plus or minus 0.01 grams. The volume of H2 which was being given off was measured by the gas syringe. The number of readings and at what intervals they were taken took place as planned in the planning experimental procedures stage, (readings of the volume of H2 given were taken every 10 seconds until the volume of H2 had reached 100cm3 or 90 seconds had passed.) The experiment was repeated twice as planned. The averages of the results were taken and plotted on a graph.
The results of the investigation are shown in the table below. All the results were taken at 21 degrees Celsius.
Results
I have plotted these tables into graphs on the following page. Adding to them are the rates calculations which took place, in order to draw the graph of the rates of reaction.
The last page with graphs on it, refers too the above table on the relates of reaction
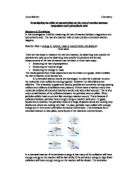
Calculating The Rate Of The Reaction and the Gradient:
In order to obtain the rate of reaction of this reaction for each different concentration of the gradient of each concentration of H2SO4 must be calculated at any single time when the reaction was taking place. The gradient must be calculated for each concentration of H2SO4 at a certain time because if this was not done the rates of reaction would be incomparable as generally the rate of majority of reactions decrease as the reactions goes on so if one rate was taken at the beginning an done at the end the rate of reaction the results would be incomparable. The time at which the gradient for each concentration of H2SO4 will be worked out will be 20 seconds. Therefore in order to work out the gradient of each concentration of H2SO4 at the 20 second mark, a tangent must be drawn to the curve at the point twenty seconds and then the gradient of this worked out, which will give us the rate of reaction. These triangles are shown on the graphs below.
Analysing Evidence And Drawing Conclusions
The graphs of the results are on the previous pages and the results used to plot the graph are the averages of the results obtained during the practical.
The graph below illustrates the relationship between volume of H2 given off and time taken for this volume of H2 to be given off by the reaction. The graph seems to show that the higher the concentration of the H2SO4 the faster the rate of the reaction and the lower the concentration of the H2SO4 the slower the rate of reaction. This is shown by the fact that the most concentrated H2SO4 used has the steepest line on the graph and the least concentrated line has the shallowest line on the graph. This is because as the concentration of H2SO4 goes up the number of H2SO4 particles in the given area increases. This results in the probability of a collision and a successful collision being higher. For example if there were 50 H2SO4 particles and 50 limestone particles in a given area the chance of a collision and a successful collision would be ‘z’. If the number of H2SO4 particles were to be increased to 200 and the number of limestone particles were to remain at 50 then the chance of a collision would now be ‘4z’ showing the chance of collision and successful collision would have increased by four times.
The maximum volume of H2 given off as shown on the graph is 100cm3, this is not because all the H2 of the reaction is given off but this is the limit of the gas syringe. However, all the different concentrations of H2 give off different volumes (as worked out in calculations in the planning stage) of H2SO4 this tells me that the limiting factor in this reaction at least for the concentrations of 1.0 molar concentration, 0.90 molar concentration would be the concentration of HCl.
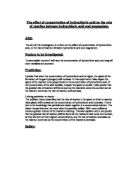
An illustration of my prediction of what the graph would look like is below.
If I now compare this to the graph of results I have, there seem to be similarities and differences. The results show that the most concentrated H2SO4 was the steepest line and the least concentrated solution of H2SO4 was the shallowest line, this obviously matches my prediction as this is what my prediction graph shows.
The last graph illustrates the relationship between the rate of reaction and the concentration of the H2SO4 solution at the point of the reaction 20 seconds. The graph shows that the rate of reaction and concentration of H2SO4 solution is directly proportional and therefore any increase in the concentration of H2SO4 solution would result in a direct and proportional affect on the rate of reaction. The fact that the line of best fit is the line ‘x = y’ we know that the relationship between the two axes and the measurement they represent is directly proportional. This is because as the concentration if the H2SO4 goes up there are more H2SO4 particles in any given area, therefore the likelihood of a collision is more likely and a successful collision is more likely, hence the rate of reaction would increase. For example if there were 50 H2SO4 particles and 50 magnesium particles in a given area the chance of a collision would ‘z’. If the number of H2SO4 particles were to be increased to 150 particles and the number of magnesium particles were to remain at 50 particles then the chance of a collision would now be ‘3z’ showing the chance of collision and successful collision would have increased by three times.
If I now compare the results of the experiment in this graph with my prediction in the planning experimental procedures stage I can see similarities and some small differences. My prediction of what the graph would look like is below.
The fact that the actual results show a trend of direct proportionality ties up with my prediction. So the higher the concentration of H2SO4 the more hydrogen is given off.
Evaluating Evidence
Overall the reliability and consistency of my experimental method and therefore my results seem to be relatively high, this can be shown by the fact that my results have few anomalies and the variability of my results are low. I was able to produce a graph from my results which seemed to tie in well with simple theory. However there were many areas in which the results could be improved in order to increase the reliability and accuracy of results.
Most of the anomalous results seemed to take place within the first five seconds and this would be due to the fact that when the conical flask had to be covered with a rubber bung, which took some time to fit on properly, this could have allowed some of the Hydrogen to escape in the initial stages. Leakages in the system of the apparatus also contributed to the unreliability of the experiment, these were not visible or possible to hear. However over a period of 90 seconds if there was to be a continuous leak although it may be small it would add up to make a significant amount of H2 loss. To try and overcome this difficulty if I were to repeat the experiment I would use better glassware, higher quality rubber and put Vaseline between the glass and the bung in order to reduce the volume of air escaping and therefore making the results more reliable.
As I mentioned in my obtaining evidence section, the gas syringe jumped and made it difficult to read values off quickly and accurately. Additionally because the gas syringe was jumping, the point at which the gas syringe was at a certain time may not have been correct as there would have been points of friction at which the gas syringe would not move until the pressure of H2 pushing it would build up and be greater than the force of the friction and then the gas syringe would jump 2-3cm3. This would cause inaccuracy of results during the time of the pressure of H2 building up and the jump taking place would cause certain measurements to be missed and if a reading had to be taken during one of these times the reading would have to be approximated.. The inaccuracy of the gas syringe was therefore overall would have been between +- 1-2cm3. To overcome this problem if the experiment were to be repeated I would use an electrical method for working out the volume of H2 released, obviously the inaccuracy of the results would then be significantly reduced.
One of the biggest variables in my results would have been the surface area of the magnesium in every reaction. The way in which the strips were cut was totally random and the control I used for the variable was also greatly inaccurate (using the eye to try and check whether the surface area is the same or not.) Due to the fact that the surface area of the reactants and the rate of reaction are directly proportional this would have made a significant difference to the results. I could minimise this error by using venire callipers to measure the magnesium strips more accurately
A further cause of unreliability in this experiment would have been the variation in ambient temperature. The Q10 rule tells us that an increase in temperature of a reaction by 1 degree centigrade doubles the rate of reaction due to the increase of two factors (strength of collisions and speed of them). Therefore we can see that any variation in temperature would cause significant unreliability in results. To minimise this error I could place the conical flask in a water bath which would decrease the variability in temperature and therefore increase the reliability of results.
One of the other major causes of inaccuracy and unreliability in the experiment would have been human error. This affected my results in many ways. One of the most important difficulties was when I the readings of H2 released were taken, the time could have been wrong by 0.5 seconds and this would have caused a measurable inaccuracy. To greatly reduce this I could use a computer to measure the volume of H2 released at the regular intervals of time required.
To further increase the reliability and accuracy of the experiment if repeated, the experiment could be repeated with more than just six different concentrations of H2SO4 and repeat the whole experiment more times. Repeating the experiment more than twice would result in a higher accuracy when averages of results are taken and by increasing the number of H2SO4 concentrations being used I would have more points on my graph making my line of best fit more reliable.
However another way of improving the experiment could be that rather than modifying the experiment use a completely new experimental technique. An example of a experimental technique which would probably be more reliable would be setting up a water bath when performing the experiment and record the number of bubbles released in a any given time. This experimental method would be more favourable because it would not have difficulties such as the gas syringe jumping however one could argue that the size of the bubbles would vary and this would result in certain unreliability in the results. The counter argument to this would be that the variability of the surface area of limestone would be the same as this or even more. Another method which maybe more favourable would be the method placing the conical flask on a top pan balance and weighing the loss of mass of magnesium per any given time. The loss of mass could then convert into H2 given off. However the problem with these two procedures would be that they are slightly long winded and require expensive apparatus for long periods of time, for example, a top pan balance.
The timings at which the readings were taken would have also been inaccurate as one had to look at the stopwatch until it had reached a time at which a reading had to be taken then look up and take the readings, by this time the reading on the gas syringe could have changed. This would have resulted in an inaccuracy of readings between +1-2cm3 and the accuracy of the stop watch would be to +-0.5-1 second. To overcome this inaccuracy I could use a data logger which would take the results for me at the times set because it could be connected to the electrical instrument to measure the volume of H2. Another inaccuracy would have been the inaccuracy of the top pan balance which would be +- 0.01 grams, however this is quite accurate for this type of experiment and would give a fair accuracy of results, however an improvement can be made and this would be to use larger amounts of magnesium however than a larger total volume of solution would also be advisable to assist this.
Overall I believe the results are definitely consistent and the reliability of the experiment seems reasonable but there is room for improvement as shown above. The reliability of the results seems to be reasonable because the inaccuracies throughout the experiment were not that great and the results seem to go pretty much hand in hand with logical theory which would mean that the likelihood of the results being reliable are higher. If the results had not gone hand in hand with the theory this would have meant either the theory is incorrect which is unlikely or the results were unreliable, however this is not the case so the results seem reliable. Additionally there is no major factor or theory which contradicts my results.
For these reasons I feel that quite a firm conclusion can be drawn from this investigation. However I do believe that a completely firm conclusion cannot be drawn as all the variables and inaccuracies in the experiment added together if controlled may cause the results to differ from the results I obtained, however, the main pattern of the results would probably be similar.

![The Effect of Concentration on the Rate of Reaction between Magnesium [Mg] and Hydrochloric acid [Hcl]](https://mbt-essays-prod-public.s3.eu-west-1.amazonaws.com/934664/listing/934664_1.jpg)