This prediction could be quantitative. If I double the yeast concentration I should get double the volume in the first thirty seconds. (The initial rate.)
Variables:
o My independent variable will be the enzyme (yeast) concentration. I will vary this using serial dilution, in order to make up the yeast concentrations. The five yeast concentrations I will use are 0.1%, 0.25%, 0.5%, 0.75%, and 1.0%. In order to make these concentrations I will make up 1.0% by having 1% catalase and 99% distilled water. Then I will half the concentration of to make 0.5%. I will half this to make 0.25%. In order to make 0.75% I will use ? of the concentration of 1.0%. But I will keep the volume constant.
o My dependant variable will be the amount of oxygen released.
The variables that I will need to control will be:
o The pH
o The temperature
o The substrate concentration
o The volume of substrate added
o The volume of yeast added
All of these control variables will need to be controlled by me, and to be kept the same throughout my experiment, in order to keep it fair and for the results to be accurate. I am only testing the effect of enzyme concentration on the rate of reaction so the other factors will have to remain the same, so that they do not affect my results.
To get accurate measurements of the enzyme and substrate I will use an automatic pipette. I will keep the volume of the reaction mix constant so it will not affect the rate. To control the temperature during the experiment I will keep the enzyme and substrate solution in a waterbath set at 30?C. To control the substrate concentration I will use the same volume and concentration each time, so that it will not affect my results. I have decided to control the pH, and keep it the same so that this will not affect the rate of reaction using a buffer.
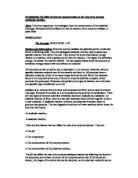
Preliminary study: To try and get an idea of what sort of method and apparatus I should use I consulted a number of biology texts. To measure the rate of reaction by the amount of oxygen given off, there were several different methods. One method (of which there were several variations) shows how the oxygen could be measured by delivering the gas through a rubber delivery tube. They measured the volume of oxygen produced by counting the number of bubbles produced. The higher the number of bubbles produced in thirty seconds meant a faster reaction rate. A diagram of this method is shown below:
I have decided not to use this method, as it is a very inaccurate way of measuring the volume of oxygen given off, as the size and volume of bubbles vary. However, using a syringe to add the yeast solution is a very good idea as it is easy to use and no oxygen will be lost.
I gained a more reliable method where the oxygen was measured using a measuring cylinder. This is a good idea but only gives the volume of oxygen produced up to every 1cm3. A burette would be more accurate as it measures every 0.1cm3, however this would be difficult to use, and there could be a risk of loosing some oxygen as I put the burette below water and seal. But using the thistle funnel through the bung is a good idea, as no gas can be lost because it is not necessary to remove the bung to add the yeast to the hydrogen peroxide.
From another source I have got the idea of collecting the oxygen in a gas cylinder instead of a measuring cylinder or burette. This would be easy to use and should not loose much of the gas, as it is tightly sealed and smooth as it is made from glass.
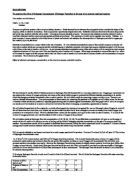
Pilot study: I carried out a pilot test in order to find out what volumes, quantities and concentrations of hydrogen peroxide to use. To do this I set up the apparatus as shown in the diagram below:
I set up these apparatus so that I could decide what concentration of H2O2 and what quantities to use, and to see what would give me decent results in the first thirty seconds. Firstly I used 5cm3 of yeast with 0.1% concentration, and 10cm3 of H2O2 with a concentration of 1 molar. (To make the concentration of yeast you dilute with distilled water.) But this did not give out very good results, as it produced little or no oxygen. Therefore I increased the quantities of H2O2 and yeast, and increased the concentration of H2O2. I finally got decent results when I used 40cm3 of yeast with a concentration of 0.1% with 10cm3 of H2O2 with a two molar concentration. I couldn't increase the concentration of hydrogen peroxide, as two molar H2O2 is the strongest concentration of hydrogen peroxide legally allowed in schools. I also didn't want to use too much of hydrogen peroxide but not too little either. With a higher volume of yeast the results were improving, as more oxygen was being produced. For my pilot study I only used yeast with a concentration of 0.1%, because if oxygen was produced with a low concentration of yeast, then I knew that it would with a higher concentration of 1.0%. From my pilot test I have decided to use 40cm3of yeast and 10cm3of hydrogen peroxide with a two molar concentration as using these quantities and concentrations, oxygen has been produced during the initial rate. During the pilot study I realised that the syringe would not hold 40cm3 of yeast, therefore
Results-pilot test:
However, I have realised that this method involves removing the bung to add the hydrogen peroxide and the yeast. This could result in loosing some oxygen whilst we put the bung back in the conical flask.
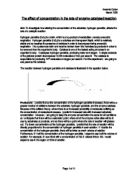
Therefore, from the range of methods I have seen I have decided to use a side-arm conical flask connected to a gas syringe. To add the yeast, my original idea was to use a syringe, although it would not hold 40ml of yeast. Therefore I will put the yeast in the conical flask with a buffer and then add the hydrogen peroxide using a syringe through the bung. I have also realized that I have not controlled the temperature. Therefore I will keep the conical flask in a water bath set at 30?C throughout the experiment. A final diagram of the apparatus I am going to use is shown below:
Apparatus:
ؠStand
ؠClamp
ؠBoss
ؠBung cut into two
ؠConical flask with side arm
ؠ10cm3Hydrogen peroxide (two molar)
ؠ40cm3 of Yeast
ؠBuffer
ؠAutomatic pipette
ؠGas syringe
ؠBeakers
ؠGoggles for eye safety
ؠLaboratory coat to protect skin and clothes
ؠStop clock
ؠSyringe
ؠWater bath set at 30?C.
I have chosen the stand, clamp and boss to hold the gas cylinder, horizontally in the air to be sure that it is not affected by any variables. The conical flask and the bung is used to hold the enzyme solution and the substrate, also to stop any gas from escaping, as we are measuring the oxygen gas. The bung will be cut in half to allow the syringe holding the hydrogen peroxide to penetrate. The conical flask has a side arm that allows the gas to be transported to the gas syringe via the delivery tube. The rubber delivery tube is used to transport the gas to the gas syringe to be measured and to minimise the amount of oxygen lost. The buffer will control the pH of the yeast. The water bath will control the temperature. I will use an automatic pipette, as it is very accurate and precise as it measures every m1000th mil. I will use a gas syringe to measure the oxygen produced. It is specially designed to measure gas and is made from smooth glass, which will allow all the gas to be collected and easily measured. This makes it very precise and accurate and is easy to use. The stop clock is used to time the initial rate. However an individual's reaction rate varies, so is not very accurate, but is the easiest way. I will be required to wear a laboratory coat and goggles to protect my eyes, skin and clothes as hydrogen peroxide, and some enzymes can be hazardous and harmful.
Risk assessment:
Hydrogen peroxide can be corrosive if strong, and an irritant to the skin and eyes. It should not be swallowed. It can corrode clothes and irritate the skin if not washed off thoroughly. Eye protection should be worn and should be handled with care. Contact with the skin should be avoided and clothing should be protected. You should also mop/clean up any spills. All enzymes are potential allergies and can irritate membranes in the eyes or nose (if inhaled). They may also cause an asthmatic attack. Eye protection should be worn and care should be taken when handling. You should avoid handling, inhaling or contact with the skin wherever possible. They must not be swallowed and spills must be mopped up immediately.
Method:
i. Set up apparatus and water bath. Care should be taken to avoid any 'gaps' where the oxygen could escape.
ii. Measure out 10cm3* of hydrogen peroxide (two molar) using an automatic pipette for accuracy. Carefully* pipette into the syringe.
iii. Measure out 40cm3* of yeast at a concentration of 0.1% using a clean automatic pipette. Carefully* add the yeast solution to the conical flask.
iv. Carefully* add the hydrogen peroxide solution.
v. Time for 30 seconds* using a stop clock, and record in a table the volume of oxygen produced.
vi. Repeat 3 times using increasing concentrations of the yeast solution. (0.1,0.25,0.5,0.75,1.0)
(*to be carried out very accurately.)
Results:
A table to show the time taken for a 1cm2 piece of filter paper to rise to the top of 10ml of 2molar Hydrogen Peroxide.
Table:
The filter paper rises because it is placed in the yeast solution, and then dropped into the hydrogen peroxide solution. My prediction would suggest that the higher the yeast concentration is, the faster the filter paper should rise. This is because there would be more enzymes; therefore there would be more active sites available to make enzyme-substrate complexes with, producing oxygen faster. The faster oxygen is produced, the more bubbles are produced and in theory, the filter paper should start to rise, as the bubbles lift it up to the surface.
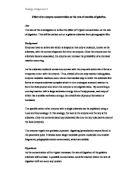
Conclusion: My results tell me that the higher the concentration of yeast, the faster the reaction, because the faster the filter paper rose. The table shows me that with a 0.02% concentration of yeast, the filter paper rose to the top of the flat-bottomed tube of hydrogen peroxide in a mean time of 71.22 seconds. With a higher concentration of yeast, at 0.04%, the mean time taken for the filter paper to rise was lower, at 36.48 seconds. These two results show a large difference in the time taken for the filter paper to rise. In fact, the result is just over half what the previous result was. This is evidence that this study is quantitative, because as If I double the concentration, I get on average, almost double the time.
With the yeast concentration at 0.06%, the time taken had lowered down to a mean time of 22.13 seconds. It had decreased further with a higher enzyme concentration of 0.08%. At this concentration there was a mean time of 15.83 seconds. This shows that the rate of reaction was speeding up. Finally at the highest concentration of 0.1% the filter paper had taken a mean time of 10.69 seconds. This proves that the rate of reaction was faster with a higher concentration, because at low concentrations the filter paper took a longer time to rise than it did with higher concentrations. This can be seen in my table and my graph. The graph shows a curve. At first the drop is rapid between 0.02% and 0.04%, as the gradient is steep, but then the drop becomes less steep, as the drop becomes more gradual. You can start to see that the graph is starting to level off as the concentration increases. It would seem that if I were to extend the curve, it would level off completely at a concentration of around 0.15%. The reaction rate would then become constant due to other factors.
Interpretation: My conclusion shows that the greater the concentration of catalase, the faster the reaction rate. I can explain this because if there is a higher concentration of yeast there will be more active sites present and available to bind with a substrate to form an enzyme-substrate complex. The reaction rate will speed up because if the number of enzymes increases, there is more chance that a substrate will collide with the enzyme and fit into its active site. Therefore there would be an increased chance of a hydrogen peroxide molecule binding with a catalase molecule, producing an oxygen product. The increased rate of reaction will mean that more oxygen is formed. This increase in productivity of oxygen will form more oxygen filled bubbles. These bubbles will lift the filter paper to the surface. So basically, the faster the rate of the reaction means more oxygen, which means more bubbles, which makes the filter paper rise faster. Therefore, the faster the filter paper is lifted, the faster the rate of reaction. This proves that my prediction is correct, as the results match my prediction, which is backed up by scientific knowledge.
Evaluation:
The experiment went well as most of the results matched my prediction. However, I have noticed that there appears to be one anomalous result. This can been seen in the table by looking at the third repeat for the 0.02% concentration of yeast. This result is very different from the other two attempts, as the result is 81.00, whilst the other results are around the mid-sixties. I can see that there is a big difference between the results as there is a large standard deviation. The standard deviation tells me how much the results deviate from each other. As you can see in the table the higher concentrations tend to have a low standard deviation. This suggests that all three attempts are similar. However, the two lowest concentrations have higher standard deviations. This is because the results are more spread out, or there is an anomalous result. The standard deviation is required to see how reliable the mean result is. If there is a high standard deviation, then the mean result will not be as accurate, as one of the three results deviate from the norm. This anomalous result will affect the mean result. In this case the means have increased due to the anomalous result. This makes the mean time different from the other two results, despite being the average the results may not be as accurate as it could be. To overcome this problem you could do more repeats, and then find the mean. The 0.04% of yeast concentration has a slight anomalous result in the third attempt, but is not so large as the result for the 0.02% concentration. Two things may have caused these two anomalous results, either the accuracy, or the technique.
For accuracy I tried to be as accurate as possible, however there were some things I didn't control. The results might not have been as accurate as they could have been when timing. I only used a stop clock, which relied on my reaction, to stop the clock. Everyone's reaction times are different so is not particularly the most accurate way of timing. Also you had to decide where you would start timing. Would you start timing as soon as it touches the bottom or when it is dropped onto the surface? This arises another problem with my method. I didn't measure the height I dropped the filter paper from. This could make the results slightly inaccurate, as if I was timing from when it hit the surface, the speed that it drops may differ slightly. Another problem with the timing was that every attempt was different. Sometimes the paper did not rise in a flat position. Sometimes the paper would start to rise then turn on its side and fall again, in which case you would have to keep on timing, as the result may be inaccurate. If this happened then when would I stop the clock? Should I stop timing when it is flat on the surface or if it is on its side at the top?
The other problems were with the technique. The size of each filter paper square were not exactly the same. Some were slightly different sizes, and some were slightly thicker than others. This could be a problem because if the paper was too big then more of the enzyme could be absorbed. Therefore more oxygen could be produced and there could be a faster rate of reaction. This would also be inaccurate. Another problem was that I didn't time how long I left the filter paper in the yeast solution. This could also have meant that more of the enzyme could be absorbs, so more oxygen may be produced causing a faster reaction rate. To overcome this problem I could time how long the paper was left in the yeast solution. However, this would cause further problems with accuracy, as everyone's reaction times are different.
Overall I feel that the biggest problem was the accuracy when timing. The paper would sometimes turn onto its side and fall, before it reached the surface. Also it was hard to decide whether to use the results when this happened. To improve this problem you would need to use something more accurate than a stop clock. Something that stops timing once it reaches a certain point. You would also need to stop the filter paper from turning onto its side and falling. You could something to keep the paper stable. If we used a different shape then it could not turn onto its side. Maybe a sphere or a cube instead of a square of filter paper.
If I were to do this experiment again I would take into account all the problems I have noticed here. I will also try to be more accurate. However despite these criticisms I do feel that my conclusion is reliable, as I only had two anomalous results, and it does support my prediction.