6 CO2 + 6 H2O C6H12O6 + 6 O2
Carbon Dioxide + Water Glucose + Oxygen
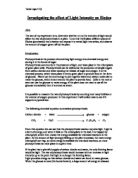
A limiting factor is one that controls a process, such as organism growth or species size or distribution. In photosynthesis the rate is affected by three factors, temperature, carbon dioxide concentration and light. Not enough light can slow down the rate of photosynthesis, without enough light a plant cannot photosynthesise very fast, even if there is plenty of water and carbon dioxide. Increasing the light intensity will make photosynthesis faster.
Variables:
In this experiment there are a few things we have to keep the same. The light intensity is the one thing I am investigating in this experiment I have to change the measurements after every 2 minutes, this is done by moving the lamp at set distances, my distances were 5 cm, 8 cm, 11 cm, 14 cm and 17 cm. We have to keep a few things in this experiment the same, the same plant, the same apparatus, the same time for adjustments (2 mins), the time has to be the same for the amount of bubbles that are counted. The same temperature, the same lamp directions, these have to be kept the same, to make sure that you are only investigating the light intensity and not anything else. The outcome is the number of oxygen bubbles given of in 2 minutes.
Apparatus:
- Lamp
- Pondweed
- Thermometer
- Measuring cylinders
- Stop watch/ clock
- Distilled water
- Paper clip
- Ruler
- Spatula
- Sodium bicarbonate for producing carbon dioxide
Method:
- Take a measuring cylinder and fill it up with distilled water.
- Add a spatula full of sodium bicarbonate.
- Pick a pondweed that has a healthy green stem.
- Put a paper clip at the end of the pondweed, to make sure that the pondweed stays down.
- Place the lamp next the measuring cylinder, measure out 5 cm (this is my first measurements).
- Wait till the pondweed starts photosynthesising.
- When there is a steady pace of bubbles, start timing and counting.
- Time the bubbles for 3 minuets and record the results.
- Repeat this with 8 cm, 11 cm, 14 cm, and 17 cm.
- Repeat this 3 more times so you get 3 sets of results.
Diagram:
Table of results:
Experiment 1
Experiment 2
Experiment 3
*The Rate of Photosynthesis is the number of seconds it takes for 1 bubble of Oxygen (O2) to appear, i.e. the number of seconds between two bubbles of Oxygen (O2).
Averages:
The averages of the results are shown in the table below:
Graphs:
Average number of oxygen bubbles given off:
Experiment 1:
Experiment 2:
Experiment 3:
Analysis:
The graphs show that in this experiment the trends are that when the light intensity decreases the rate of photosynthesis decreases so when the distance of the lamp increases, the amount of bubbles decreases. My prediction was that:
“The oxygen bubbles will decrease when the lamp is further away from the measuring cylinder, because light intensity is a factor of photosynthesis. The plant may stop photosynthesising when the pondweed is at the furthest distance from the lamp (8cm). Without light, the plant will stop the photosynthesising process, because, light is a limited factor. However once a particular light intensity is reached the rate of photosynthesis stays constant, even if the light intensity is the greatest. If I plot distance of the lamp, against the number of bubbles per 2 minuets, I will get a straight linear graph which will not go through the origin.”
I had no anomalies and the experiment was sufficient and accurate. My experiments were fair tested.
Evaluation:
Considering the reliability, I think that I have done enough repeats, I repeated my tests three times which is the average amounts of time to repeat it for a fair test. All my results show the same trends, that when the distance of the lamp increases, the number of oxygen bubbles produced in 2 minutes decreases, so meaning that when the light intensity increases the rate of photosynthesis decreases. There were no anomalies in all my graphs; this indicates that I did all my experiments fairly.
I have investigated enough distances, because 5 measurements are the average amount of distances in one experiment. I have controlled all my variables – Input variables was the light intensity, the output variable was the measurements and the control were, the same time, around the same temperature and the direction of the light had to face the same way. Temperature was a tricky one to control but because is a limiting factor and might change the rate of photosynthesis. However this was alright in my experiments because there was no great range of temperature changing. There are many other further work I could of done for this experiment apart from changing the distances from the lamp and the measuring cylinder, you can change the light intensity by maybe changing the watts in the light bulb, changing the colour of the light by putting different transparent coloured paper, changing the pondweed by finding a pond weed after every experiment, changing the temperature by using a water bath and heating it to a certain temperature, this would be hard to control. Changing the amount of carbon dioxide by adding a certain amount of sodium bicarbonate, and many more but this is all that I can think about.