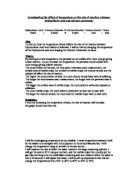
Prediction.
I think by increasing the temperature of acid, the rate of reaction will increase.
My graph should look like this
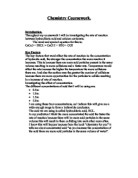
I will be investigating temperature as my variable. I chose temperature because it will be the easiest to investigate with the equipment in the school laboratories. I will change the temperature using an ice bath or bunson burner.
I will measure the rate at which the water moves in the large measuring cylinder. I will get the acid at 10˚C using an ice bath, add the marble chips then quickly put the gas tube and bung into my small flask containing acid and measure where the water is every 10 seconds. I will repeat this twice. I will do all my experiments like this but change the temperatures from 10ºC to 30ºC to 40ºC to 50ºC to 70ºC.
I will keep the concentration of acid (1 molar), the mass of marble chips (5g), the volume of acid (15cm cubed) and the time between measurements (10 seconds) the same.
Apparatus.
Large measuring cylinder
Conical Flask
Large tub
Hydrochloric acid (15cm)
Water
Marble chips (5g)
Gas tube with bung
Safety glasses
Stopwatch
Bunson burner
Tripod
Gauze
Heatproof mat
Thermometer
Small measuring cylinder
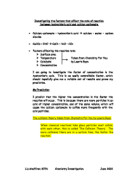
Diagram.
Method.
Firstly I will set up the apparatus as above. Then I will measure out the correct measurements of acid and marble chips. I will fill my large measuring cylinder with water, place my hand over the open end, turn it upside-down and plunge it into the tub of water. I will place the end of the gas tube without the bung on I up into the large measuring cylinder. I will cool/warm the acid to the correct temperature, add the marble chips and quickly put the bung on and start the stopwatch. Every 10 seconds I will take a measurement of where the water is in the measuring cylinder and record it. I will repeat the same experiment twice. I will do this for all the different temperatures.
Results.
10º
30º
40º
50º
70º
Graph.
See page 5.
Analysis.
My evidence shows that the higher the temperature of the acid, the faster the CO2 is given off. There are no trends or patterns shown in my results therefore not completely following my prediction.
Evaluation.
The experiment went Okay. Most of the results are relatively close to each other.
There were no anomalous results for the 10º measurements. In the results for 30º, 20cm cubed is anomalous. There were no anomalous results for the 40º measurements. In the measurements for 50º, almost all of the results in the second experiment are anomalous. To make the average correct I left these results out of the calculations. I identified the anomalous results by highlighting them.
All of the results in the second experiment of 70º were anomalous. I left these out of the calculations for average and highlighted them to show they are anomalous.
The following caused problems with the experiment: -
- The acid was a different concentration from one experiment to another. To overcome this problem I could make sure the acid was the same molar and use a pH probe to be sure.
- Some of the gas escaped before I put the bung and gas tube on therefore not giving accurate results. To overcome this problem I could get somebody to put the bung in just as I added the marble chips.
- Some of the marble chips did not go into the acid when being added. This meant there were not exactly 5g of marble chips making the results inaccurate. To overcome this problem I could use a potassium carbonate tablet instead of marble chips.
- The temperature of the acid would have changed after been taken off the bunson burner or out of the ice bath. This would mean the results of temperature were not accurate. To overcome this problem I could warm/cool a water bath to the correct temperature and leave the acid in that while the reaction was taking place.
- The readings of volume of water off the large measuring cylinder were not accurate because it is difficult to take an accurate reading at exactly every 10 seconds. Also there are not many measurements on the side of the measuring cylinder. To overcome this problem I could use a friction free syringe. This would be easier to read off and could be brought to eye level.
My results do not completely support my prediction. The graph looks a lot different to how it would with the correct results and how my prediction explains.
I could do extra work to try to get more accurate results such as: -
- Investigating more temperatures (5º, 15º, 20º, 60º, 80º, 85º and 90º) as well as the original temperatures.
I would do the experiments by making a water bath of the correct temperature and place the acid in it. I would set up the original apparatus the same but this time once the acid had reached the correct temperature I would leave it in the water bath and do the reaction while the acid was still in the water bath.
I could also repeat my experiments 4 times instead of twice therefore being able to spot anomalous easier and making sure my experiment was fair each time I did it.
By Emma Cromarty.