With this experiment, I must take into account that temperature has an affect on reaction times so tests must be carried out at roughly the same time of day.
Range and Number of Results:
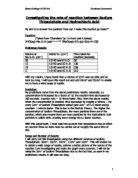
I will carry out this investigation using five different volumes of Sodium Thiosulphate: 50cm³, 35cm³, 20cm³, 15cm³ and 10cm³. This will enable me to obtain a wide range of results, achieve a better picture of the nature of the reaction I am investigating and make the graph more accurate. I will not be using the 5cm³ of Sodium Thiosulphate due to the fact that, as seen in my preliminary results, it will take too long.
Equipment:
Fair Testing:
To ensure a fair test, I will make sure each piece of apparatus I will use is clean to minimise cross-contamination, enabling me to achieve a more accurate a reliable set of results. I will also make sure that the timer is started and stopped at the same point of the experiment and solutions will be made as accurate as possible to ensure that tests correlate with each other better.
Risk Assessment:
Throughout this experiment, many risks may arise. I will make sure I wear safety glasses at all times to minimise the risk of chemicals entering my eyes and damaging them. I will also make sure that I know how and when to alert my teacher if a problem does occur, such as broken glassware or chemical spillages. I will also use a bench mat so that the bench will not be damaged if there is a chemical spillage.
Method:
-
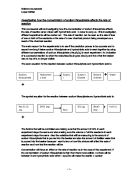
Measure 50cm³of Na₂S₂O₃ and 10cm³ HCl and pour them into separate beakers, making sure you take note of which chemical is which (as both are colourless!)
- Place the conical flask onto the black cross so that you can see it through the base of the flask. Set up the timer and pour the two chemicals into the conical flask. Start the timer immediately.
- Keep an eye on the black cross through the top of the conical flask. When you can no longer see the cross through the solution, stop the timer.
-
Record the results and repeat with other concentrations of Na₂S₂O₃. (Make sure concentrations are accurate and always of an equal volume)
- Between each test, make sure all apparatus is clean to minimise cross-contamination and achieve better and more accurate results.
Results:
Analysis:
This graph shows my results, i.e. Time against concentration. It shows that there is s definite curve in the results, as expected for this experiment. There may be a slight anomaly in the 20% concentration, though the result is not too far off. The rest of the results are quite close to the trend line. This therefore shows that as concentration decreases, the time taken for the reaction to take place increases. These results show that as concentration is increased by a factor of 5, reaction time decreases by roughly 4 minutes ∴ reaction rate ≈ 8 times faster, close to my prediction of 10. Reaction rate can be seen clearer on the graph below:
(As volume increases by 10, rate increases by about 5, therefore 2 times as fast thus for every 10cm³, the reaction rate doubles.)
This graph shows concentration plotted against reaction rate (x1000). The reaction rate is worked out as follows: 1 unit of sulphur.
Time taken
In essence, this really means 1 over the time taken for each concentration. This should turn out to show a strong positive correlation and as seen in the graph, my results are quite close to the line of best fit∴ my results are quite reliable. My second prediction is not accurate. There seems to be no definite time gap between each concentration.
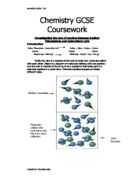
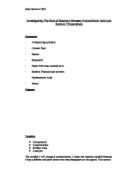
The Science behind this is the Particle Theory. The higher the concentration of Sodium Thiosulphate, the more particles there are in the solution, which also means there are more particles for the Hydrochloric Acid particles to collide with, creating more energy thus a faster reaction.
Evaluation:
Overall, I believe that the experiment was a success. The results were quite reliable, as seen in both graphs with my results being close to the line of best fit. There are a few anomalous results, which could be a bit closer to the line of best fit, though they were not too bad (e.g. 35% concentration for the reaction rate graph.) My first sets of results for the 50% concentration were too high compared to my other results, so I had to re-do them. It later occurred to me that I had done the test at a different time of day to the other results, resulting in a different temperature. This, as I remembered from previous lessons on how reaction rates are increased, would have affected my results, so the new results were done at roughly the same time of day, and therefore temperature. I also made a mistake in calculating the reaction rates of the sulphur as I mis-typed the result into my calculator and got a completely anomalous result. This was rectified as soon as I noticed the error. As I have already said, temperature may affect the results and make them faster/slower depending on the temperature the chemicals are stored at and the room temperature and finally, I believe that my investigation has proved that concentration has an affect on the results as well.
Using a measuring meant that my solutions were not as accurate as they could have been, e.g. when calculating 5cm³ volume in my preliminary results, the 10cm³ cylinder would have an error of 0.1cm³ each way, calculating as 20% difference, as seen in the formula below:
% Error= 0.1 x100
5.0
Using a Burette would have meant that my solutions would have been more accurate than they were.