Investigating the rate of reaction of enzymes in the clearing of photographic film.
Investigating the rate of reaction of enzymes in the clearing of photographic film
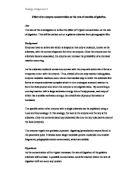
What are enzymes and what do they do?
Enzymes are proteins that speed up the rate of reaction in living things without being changed themselves. They are composed of polymers of amino acids and are biological catalysts.
They speed up reactions by a process called the induced fit hypothesis. Originally it was believed that the 'lock and key' hypothesis was how the enzymes work, but this is now believed to be incorrect because the enzymes can change shape so that the substrate (the thing that is broken up) can fit into the active site of the enzyme, which is why it is called the induced fit hypothesis. The lock and key hypothesis suggests that the enzymes are the correct shapes without having to change for the substrate to fit in, which they often are not. The substrate enters the enzyme and is digested in the active site of the enzyme.
Aims of my investigation
In the investigation I am going to study one of the four factors that alter the rate of reaction of trypsin in the clearing of photographic film. In photographic film is the clear acetate at the bottom and on top of that is geletin (a substrate) which has silver salts in it. When trypsin is added, the geletin is broken down and the acetate becomes clear. This can occur at different speeds depending upon the factors acting on the trypsin. These factors are pH, temperature, concentration and inhibitors. I will explain these.
PH
This can alter the rate of reaction because if the pH is too high or too low for the enzyme, it will become denatured, where the structure of the enzyme is changed so that substrates will no longer be able to fit inside the enzyme and therefore will not be digested. Most enzymes work best at pH 7, although some enzymes in the stomach work best in very acidic conditions (pH 1 or 2). The enzyme in my investigation (trypsin) works best between pH 7 and 8, because it works in the duodenum, which is slightly alkaline as pancreatic juice, is present in the duodenum, which is alkaline.
Temperature
Temperature can alter the rate of reaction because enzymes work best at 40°C and if the temperature is lower then the molecules will move slower and therefore there will be less collisions of enzymes with substrates and the rate of reaction will be slower. If the temperature is higher than 40°C then the enzymes may become denatured and they will not work properly, slowing down the rate of reaction or if the temperature is high enough to denature every enzyme, no reaction will occur.
Concentration
There are two ways that concentration can affect the rate of reaction, these are concentration of substrate and concentration of enzymes. The concentration of substrate can alter the rate of reaction because if it is higher then there will be more frequent collisions with enzymes and therefore a higher rate of reaction. If the concentration of the substrate is lower then collisions of enzymes and substrates will be less frequent and the rate of reaction will be slower.
The concentration of enzymes affects the rate of reaction in a similar way because if there is ...
This is a preview of the whole essay
Concentration
There are two ways that concentration can affect the rate of reaction, these are concentration of substrate and concentration of enzymes. The concentration of substrate can alter the rate of reaction because if it is higher then there will be more frequent collisions with enzymes and therefore a higher rate of reaction. If the concentration of the substrate is lower then collisions of enzymes and substrates will be less frequent and the rate of reaction will be slower.
The concentration of enzymes affects the rate of reaction in a similar way because if there is a lower concentration of enzymes then there will be less frequent collisions and the rate of reaction will be slower. If there is a higher concentration of enzymes then there will be more frequent collisions and therefore a faster rate of reaction.
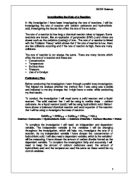
Inhibitors
These are a sort of poison that can be added to an enzyme and will block off the enzyme so that no substrate can enter the enzyme. Therefore the substrate can no longer react with the enzyme so this will certainly slow down the rate of reaction.
Apparatus
For this experiment I will need: a Bunsen burner, a tripod, a metal gauze, a heat proof mat, test tubes, a large beaker, pH buffers at different pH's, trypsin, a stopcock, a syringe that measures cubic centimeters and photographic film.
Method
) Set up the equipment as shown in the diagram below:
2) Add to one test tube 2cm³ of trypsin at a concentration of 2%. Repeat this using all pH buffers there are and then add 2cm³ of each of the different pH buffers to the test tubes with trypsin in. Label the test tubes with the pH that is applicable to each tube.
3) Heat up water in a large beaker to 40°C to make the beaker three-quarters full.
4) Put the test tubes in the water and wait until the contents of the test tubes are 40°C, when they reach 40°C, add 1 square cm of photographic film to the tubes at the same time (get somebody to help do this at the same time) and start the timer.
Keep the thermometer in the test tube so that if the temperature drops, the Bunsen burner can be put under the beaker until the temperature reaches 40°C, then the Bunsen burner can be removed from under the beaker.
5) When the photographic film in the tubes goes clear, press the red button on the stopcock so that the clock stops but when the red button is pressed again the clock will go to the time that it would have been on if the clock had not been stopped. This is useful so that more than one result can be obtained without having to use more than one clock.
6) Repeat each result at least once so that an accurate average can be obtained.
Repeat any anomalous results.
Fair Test
The experiment must be a fair test or I will be getting a lot of anomalous results and there may not be a clear pattern in the results. To make the experiment a fair test I am going to make sure that volumes of trypsin and pH buffer are the same in each experiment and the size of the photographic film is the same. I must also make sure that the temperature of the water and the trypsin and pH buffer remains at 40°C to keep the experiment accurate.
I will also need to make sure that the photographic film is completely clear before I stop the timer. When I think it is clear I will press the red button on the timer and if the film goes no clearer I will take the time that I paused the timer at. If it does go clearer I will continue the timer and stop it when it goes clearer.
Safe Test
As well as the experiment needing to be a fair test, it must also be a safe test for it to be successful. I must make sure that safety goggles are worn at all times in the experiment as trypsin would be very damaging if it got into the eye as it breaks down protein and most of the eye is made of protein. Also as a Bunsen burner is to be used in the experiment I must be careful when it is alight.
Prediction
I will now predict what will happen at the different pH's that I am going to study (pH 5, 6, 7, 8, 9 and 10).
The rate of reaction should be slower when the pH is lower than 7 as there are more enzymes becoming denatured at lower PHS. There should be a faster rate of reaction as the pH goes up until it is at 7 where the enzyme works best. When the pH goes higher than 7 the rate of reaction will be slower as more enzymes start to become denatured.
From this, I can predict that when the results are plotted on a graph the curve should be similar to that of y = x². It is unlikely to be a completely smooth curve and I may get anomalous results, which will make the graph look different.
Results
I will now draw a table of results for my experiment.
Time(seconds)
pH
2
Average
5
330
320
325
6
98
77
87.5
7
03
16
09.5
8
22
40
31
9
69
81
75
0
237
249
243
(Graph on next page)
I will now draw a graph of rate of reaction, which is worked out by dividing 1 by the time.
Table of values for rate of reaction graph:
pH
/Time
5
0.0031
6
0.0053
7
0.0091
8
0.0076
9
0.0057
0
0.0041
(Graph on next page)
Conclusion
The graphs that I have drawn with the results that I obtained from my experiment seem to be quite accurate, although the pH - Time graph is supposed to be symmetrical, which it is not as the results after pH 7 go in a less steep curve than the results for lower than pH 7. The gradient is steeper below pH 7 than above pH 7.
This could be because of inaccuracies in measurement but as the results for all of the points above pH 7 seem to fit well to make an accurate curve, there could be another reason for the change in gradient above pH 7. The structure and properties of trypsin could be a reason; for example, it may not be denatured, as quickly at PHS above 7 than PHS below 7, so therefore the graph would look similar to the graph that I have drawn. An acid could do denature the enzyme than an equivalent alkali because of the structure of the enzyme or the acid or alkali. My prediction that the rate of reaction would be slower as the pH goes lower or higher than 7 is correct. This is because trypsin works best at pH 7 and anything above or below pH 7 will begin to denature the enzyme, the more the pH differs from 7, the more enzymes that become denatured. I also predicted that the graph would be similar to that of y = x², which it is not identical to but there is a similarity in the general shape of the graph.
Evaluation
There appears to be no clear anomalous results, although the pH 9 result on the rate of reaction graph seems to be slightly inaccurate as it is slightly higher than expected. As my method and plan was to make the experiment a fair test and if I had made sure that the results were exactly accurate, the results should have been near perfect. But because I could not ensure exact measurement was used, this could be a possible reason for the slight inaccuracy in the results.
I tried to keep accurate measurements in my experiment and I kept the temperature of the beaker within a couple of degrees of 40°C. There is an inaccuracy that cannot be ruled out of my experiment, unless there is another way of performing the experiment, and that is human error. It is not perfectly clear in many cases if the acetate is clear or not, and it is hard to tell. This will be a problem unless another way of is found to stop the clock. One way which would make the stopping of the clock at the right time would be to use a light on one side of the test tube and a light sensor on the other side of the tube connected to a stopcock. When the light sensor detects light through the acetate when it is clear, it would stop the clock. This would eliminate the problem of human error in stopping the clock at an incorrect time.
Although there will be slight inaccuracies in my results, the basic shape of the graph is definitely quite clear. The graph shows that as the pH increases from 5 to 7 the rate of reaction increases and as the pH increases from 7 to ten the rate of reaction decreases. I could make my results even more clear by using more pH values, I could use from 3 to 12, and some of which are not available in school. I could try mixing an even quantity of two consecutive pH values to gain a midway pH value. This would give me much more accurate results and any anomalous results would become much clearer and I could re-do them and hopefully gain a more accurate result.