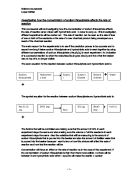
This diagram shows how the apparatus will be set up for the experiment.
This table shows the measurements that will be used in each experiment.
This experiment will be done twice with the above measurements because, there may be something wrong with the first set of results. I have chosen to use these measurements for each substance, because when placed in a 200ml beaker, the light sensor can detect the light change due to the reaction, well.
5ml of hydrochloric acid works well, as this does not make the reaction too fast or too slow.
The apparatus will be set up with the sodium thiosulphate in a beaker. The light sensor will be switched on, and five seconds later the hydrochloric acid will be added.
Eventually, when the light level through the solution drops to 10 lux, the experiment will be stooped and the time is recorded.
The safety precautions I will take are,
- To wear safety spectacles. To protect my eyes from the substances.
- To keep all electrical equipment away from water and other liquids.
Before I will do my main experiment I will do a preliminary experiment to make sure this experiment works, and so my final experiments display clear results. This will be done using the same amount of hydrochloric acid as in the real experiments (5ml) and an average concentration of sodium thiosulphate (20ml water and 30ml sodium thiosulphate). These amounts will be used so it will display very similarly what will happen in my real tests, so if it will display accurately if the experiment will work or not.
The experiments I will carry out are:
- Adding 50ml of sodium thiosulphate to 5 ml of hydrochloric acid.
- Adding a mixture of 10ml water and 40ml sodium thiosulphate to 5ml of hydrochloric acid.
- Adding a mixture of 20ml water and 30ml sodium thiosulphate to 5ml of hydrochloric acid.
- Adding a mixture of 30ml water and 20ml sodium thiosulphate to 5ml of hydrochloric acid.
- Adding a mixture of 400ml water and 10ml sodium thiosulphate to 5ml of hydrochloric acid.
In each test I will be at the computer to make sure everything on it is in working order. My friend will pour the 5ml of hydrochloric acid into the beaker containing the sodium thiosulphate. I will tell my friend when to pour the hydrochloric acid into the beaker, so all test are the same.
For each of these tests I will measure the light intensity through the solution, and find out how long it takes for the light level to drop to 10 lux.
I will do all of my experiments twice and find an average rate of reaction.
I have decided to use these measurements because it is easy to measure the light intensity in a 200ml beaker with the light sensor. I did a practise test to see how much hydrochloric acid to add, and I found 5 ml gave the best results, the reaction was not too fast or too slow, so it was easy to draw a graph.
Here is an example of the result table I will use for my experiment
Results
Experiment group1
Experiment group 2
These results show that the more concentrated the sodium thiosulphate the higher the rate of reaction. This can be seen in the graphs because the beginning measurements have a higher gradient than the end measurements and they reached 10 lux of light on the first experiments than the last experiments.
The results are like this because the more concentrated the sodium thiosulphate the more sodium thiosulphate molecules there are, making greater odds of these molecules coming into contact and reacting with the hydrochloric acid molecules. So the reaction time is lower and the reaction rate is higher.
The graph shows the difference between the first rates of reaction is about the same with a slight increase each time. But the difference between the fourth and fifth test is much greater.
These results do mach my prediction, but I did not expect the difference between the tests to be as it is. I expected the difference to be constant.
I think I have taken enough measurements for this investigation, because five results showed the rate of reaction increases as the sodium thiosulphate increases. The rate of reaction graph sows the difference between each test, well.
I have checked my results to make them more accurate, in case of an error or errors that could have been made in the first group of experiment. I did this by doing another group of experiments I the same way.
I got the same pattern of results, but the light intensity in experiment group 2 was higher than in group 1, though I kept this constant for all of the tests in the second group to make it fair. Though both of these experiments showed very similar rates of reaction.
I have the correct evidence to show that the information is true, it can be seen in the rate of reaction graph.
If I were to do this experiment again, I would change the set up of the apparatus so it would look like this,
I would do this to reduce interference from putting the hydrochloric acid into the sodium thiosulphate, as when I did my experiments at that moment the light sensor was covered.
This technique would also reduce interference from surrounding light, as the light sensor would be right next to the beaker.
Other than this I would not change anything else, as the brightness from the light box made it easy for the computer to pick up the changes in light and the variable was easy to change and compare.
The results, which I have obtained, show that on both sets of experiments, the results from the lowest concentration of sodium thiosulphate are both far from the line of best fit. This is also shown in the 40% concentration of sodium thiosulphate on the first experiment is also far from the line of best fit. This shows that an error could have occurred during these tests which would make the experiment unfair.
The first two incorrect results are both below the line of best fit. This shows that it may be common for this test, though the results for experiment group 1 and 2 are quite far apart, suggesting that these results are incorrect. These results may be incorrect due to a change from the set measurements or a lower temperature.
The second in correct result is above the line of best fit, showing the reaction rate was higher. This could have been due to a higher background light level or temperature.
These results are not good enough to show a perfect pattern in the rate of reaction, as it is difficult to judge whether the first two results are incorrect or part of the pattern, because there are only two results, which are quite far apart. If more sets of experiment were done it would show more clearly if these results are incorrect or part of the pattern.
To investigate the rate of reaction between these chemicals I could have, marked a cross on a piece of paper, and put it behind the beaker containing the solution and timed how long it took for this cross to become invisible through the solution. This is not as accurate as it does not show the rate of reaction for the whole experiment, and it is far less accurate.
Another experiment that would prove the collision theory would be to time how long it takes for a solid, with varying surface areas for each experiment, but same mass, to dissolve in a liquid with which it reacts. This experiment would be difficult because it is not easy to change the surface area of a solid, without changing the weight. It would also be less accurate, as a human would have to make judgements of when the solid has completely dissolved, and this would make a difference in the results due to human error.
Errors that could have been made in my experiment were, thickness of glass beakers varied very slightly, slight changes of voltage running through the light bulb, changes in surrounding light and thickness and shape of glass surrounding the bulb in the light box. These could have been slightly different for each test, which could make it an unfair test. I would try to keep all these things constant if I were to repeat this experiment.