We chose to use 6 variables and repeat the experiment as many times as possible, then take an average result.
Hydrogen Peroxide + Catalase → Water + Oxygen
2H2O2 + Catalase Enzyme → 2H2O + O2
Apparatus
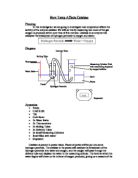
A Conical flask, 1 large beaker, 1 Measuring cylinder, 1 Blender, 1 Stopwatch, 1 Manometer, 50 ml Hydrogen Peroxide, 1 Bung, 6 Beakers, 1 Baking potato, rubber tubing, Safety goggles.
As oxygen is produced it travels up the manometer and displaces water giving us an accurate reading of how much oxygen has been produced.
Fair Test
Making sure my experiment is fair is very important for accurate results. I will keep everything the same. Such as temperature, so that the enzymes are working under the same conditions, as when temperature increases enzymes move quicker and will collide more this would greatly affect our experiment. Also using the same potato so that the strength of catalase does not vary. The only thing that will change is the one variable, the concentration of Hydrogen Peroxide or Substrate, which effects the concentration of the solution. We were very careful when pouring in the hydrogen peroxide and potato as we noticed when doing our preliminary work (a practice experiment) that when some substrate did not reach the bottom and ran down the sides of the flask this affected the amount of oxygen produced.
We must also keep the hydrogen peroxide in a dark container as light can break it down.
Method
- Set up apparatus: - The conical flask attached to rubber tubing attached to the manometer and a second piece attached to the manometer and over a large beaker.
- Fill the manometer with water as far up as can be measured (80ml). Throughout the experiment if any water is displaced into the large beaker replace it so the manometer always measures up to 80 ml.
- Place a cut up potato in a blender. We must blend the potato to release the enzymes.
- Measure out 6 x 150ml into the 6 beakers.
- Add one beaker full of blended potato to the conical flask.
- Add 0.5 ml of Hydrogen Peroxide.
- After 30 seconds take a reading of how much oxygen has been produced.
- Repeat steps 5-7 five more times but change the amount of hydrogen peroxide added each time.
- Wash Beakers and repeat steps 3-9 with the same type of potato.
- Clear away equipment and find average for results.
Safety
Always wear safety goggles, keep bags and coats away from worktops and floors and always wash your hands after handling hydrogen peroxide.
Results
Table of Results
I decided to discard the results from experiment 1 as anonymous results because the results I repeated for a third time suggest that my second experiment was a lot more accurate.
Graph to show the relationship between the concentration of the substrate in the solution and the amount of oxygen produced in 30 seconds
Analysis
From my table of results and graph I can see that Experiment one is probably unreliable and therefore I decided to discard its results from my analysis.
From my results I could tell that as the concentration of hydrogen peroxide increased between 0.5 and 2.0 ml, the output of oxygen increased uniformly and the input and output were directly proportional to one another, the graph shows a strong positive correlation between points.
The higher the concentration of hydrogen peroxide, the more oxygen there was released in thirty seconds. For every 0.5ml extra added, 20ml of oxygen was produced this shows a pattern which is easily observed from the table and graph.
However for the input of 2.5ml and 3.0ml there were some unpredicted results. The results did not follow the line of best fit but instead started to form a curve of best fit. My explanations for this are maybe the results are unreliable but this is unlikely as we repeated these specific results for a third time. Another possibility, which I noticed from my graph was that the last two results form a curve, this suggests that the experiment is reaching a peak at which the concentration no longer makes a difference and for thirty seconds the output speed will be the same or at a very negligible difference. This is because the enzyme can only work at a certain speed (at its optimum temperature and pH) and even if it is surrounded by its substrate it will still only be able to break down at the same speed, after a certain concentration of hydrogen peroxide is present and the enzyme no longer has to search for its substrate the speed will remain the same. Therefore the line of best fit is not necessarily correct; instead there should be a curve of best fit, which is shown by the average results. I predict the graph would form a curve until this ran into a straight line across.
I believe that my results agree with my prediction quite well, the more hydrogen peroxide we added to the potato, the more oxygen was produced. My results show that for each 5.0 ml of hydrogen peroxide added to the solution, 20 ml’s more of oxygen was produced in the first 30 seconds. Therefore the more hydrogen peroxide present the more substrate present for the enzyme to collide with and break down meaning in the first 30 seconds of contact the enzymes were able to work quicker when there was more hydrogen peroxide present in the solution because enzymes would collide with a hydrogen peroxide molecule much quicker than in a solution with less hydrogen peroxide where the enzyme would waste time moving around before it collided with a hydrogen peroxide molecule. My theory was true until when 2.5 ml of hydrogen peroxide was added. Then there was a result that my hypothesis did not account for. My graph started to curve showing that it was no longer rising by 20 for each 0.5ml’s added. This was not what I predicted so I would have to conduct another experiment using higher variables for the amount of hydrogen peroxide added in order to prove my theories.
Evaluation
I was happy with the results I obtained from my experiment because I thought it was quite accurate. I could tell this from the straight-line graph that I was left with. I had a lot of odd results in my first experiment; I think this was due to human errors of not pouring the hydrogen peroxide into the conical flask directly and not measuring it out well. Because of this I repeated the experiment again and with those results where there were very different answers, I repeated for a third time to be sure on which answer was correct. From this, and also because it did not follow a pattern I found that my first experiment was probably very inaccurate and decided to discard the results.
I think my method was very suitable as the manometer was a very accurate way of discovering how much oxygen was produced. I am also glad that I chose to measure oxygen and not water because there was a lot more oxygen produced and it was therefore easier to measure. I am happy that I chose the variable of concentration because I think it was a lot more accurate to measure than trying to keep a temperature accurate.
I think my results are reliable because of the strong pattern they have followed and therefore they have helped me come to a firm conclusion.
To improve my experiment I would measure the results of adding 3.5ml of hydrogen peroxide then 4, 4.5,5 e.t.c so that I could come to a firm conclusion and prove my theories of why the graph curves at the higher points.
I think a more accurate way of performing this experiment would be on a computer simulation as there would be no room for human error, which can have catastrophic effects on results. As the computer would have had to have been programmed with certain knowledge about the results of the experiment to be possible there are many other ways in reducing the room for human error, such as using a funnel to pour hydrogen peroxide into the conical flask so that none can drip down the sides.
One problem with my experiment was that it was performed on a few different days meaning temperatures could be slightly different and also different potatoes had been used. In ideal conditions the temperature would remain the same and also the potato. We were also assuming that the potatoes enzymes were not denatured in any way. In a more accurate experiment this would have needed to be checked.
Another main disability was that it was only possible to measure to the nearest 5ml on the manometer accurately because of the rapid rate the oxygen was filling the manometer at. Ideally we should find a way of preventing the oxygen from moving anymore at 30 seconds, such as squeezing the rubber tube so as no more oxygen could pass through.
If I were to repeat the experiment again, one more change I would make would be to take a measurement after 30 seconds and then again after 1 minute to see how things changed. We did try this but we found the oxygen flushed all water out of the small manometer. To repeat the experiment a larger manometer would be needed.
Another way of repeating this experiment would be to change the temperature instead of concentration, this would be an interesting experiment as temperature affects the rate at which enzymes work. At the beginning I said I had chosen concentration as a variable over temperature this is because I believe it would be easier to measure and the easier it is to measure, the more reliable and accurate results you can obtain.
To improve my experiment I would use a gas syringe to measure the amount of oxygen produced as I think it would be a very accurate way of obtaining results. The apparatus would look like this.