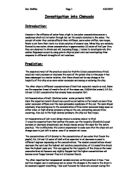
The very high concentrations may decrease the mass so much that the cell cytoplasm that is made up mainly of water will begin to shrivel up. This may explain the expected limpness of the chips, as there is nothing pushing on the cell wall to keep the cell turgid. If the cytoplasm shrinks enough due to water loss, it may tear away form the cell wall. This is called plasmolysis. Below is a diagram of how plasmolysis occurs and should do during this experiment:
0mins 5mins 10mins
Below is my prediction of the graph “percentage change in mass against concentration”:
Plan:
The apparatus were set up as shown in the diagram below:
0.0 0.2 0.4 0.6 0.8 1.0
Before the practical was started, precautions were taken to safety due to the concentrations of NaCl stinging if contact with the eyes was made. To prevent this, goggles were worn. Also, ingestion of the solutions would not cause too much harm but would be unpleasant and my cause vomiting so care was taken to wash hands and keep tubes away from mouths. Lab coats were worn to stop spillages getting onto clothes.
The six different concentrations of sodium chloride (NaCl) were added to the test tubes set up in the rack as shown above. Into each tube, 30.00ml³ of the appropriate concentration of solution was added from measuring cylinders in which the concentrations had previously been measured. The tubes were then marked with stickers as to which concentration they contained so the concentrations are not muddled up during the writing up of the results. The potato chips were then removed from the bucket in which they had been stored in around a 0.2 mol concentration of NaCl to simulate the normal concentration of NaCl solution in the ground. The chips were chosen to be of the same length and width as could be done in order to try to get the closest masses as could be achieved my guess work. The chips were then cut down to similar sizes using a scalpel (I tried to keep all mine at 5.5cm), making certain to remove any skin left on as this could prevent osmosis as the skins are to stop the potato from drying up and so would hinder osmosis. The chips were then dried and individually weighed to get the mass of the chips having just been removed from the simulated ground. The chips were then inserted into the solutions, starting with the 0.0 concentration (water) first and the 1.0 concentration last. The chips were staggered during the insertion to the solution in order to give sufficient time for readings to be taken. Each time a chip was removed; it was removed with tweezers or a needle and dried off so that the solution in the outside of the chips would not affect the overall results in any way. The chips were dried with paper towels. Each time a chip was removed it was weighed on the balance to find its new mass and the results were recorded in a table like the ones below. These results were then put into graphical form and these graphs are shown in the results section of the investigation. Once the practical was finished, it was repeated again, however the solutions and the chips were replaced but exactly the same measurements were used and the chips were as close to the same mass as the previous practical as was possible at the time. This was done to make sure that the results obtained in the preliminary practical were not fluke results but the trends observed were proper ones and not strange results. Each time a chip was weighed on the balance, the balance was reset so that any leftover solutions on the balance would not affect any other results taken from the balance. After the preliminary practical I chose to use a balance over the length and angle of dangle methods because I felt it was more accurate and less open to human error.
From this plan enough results were obtained to get a good graph and the 15-second intervals was enough time in which to perform the test each time. Each time a result was taken, the reading on the balance was allowed to settle before the reading and chip was taken as they sometimes waver about a certain value.
Results:
1st set
2nd set
3rd set
Average results
Percentage Change of mass from start to finish
Observations
There was a marked change in the chips turgidity, as the concentrations higher that 0.2 mol/liter are floppy, or flaccid and more so as the concentrations increase. However the chips in the 0.2 mol concentration of NaCl remained around the same value in all of the experiments. The concentrations below that, i.e. the 0.0 mol concentrations (distilled water) were more turgid and so therefore less floppy. The chip immersed in the 0.0 mol concentration was more rigid than the chip immersed in the 0.2 mol concentration.
Conclusion:
By looking at my graph of average chip mass against time and observations I can see that there is a positive correlation for the distilled water, gaining mass and becoming more turgid as time goes on, starting at 4.5 grams and finishing at 4.65 grams shows an increase of 0.16 grams. That’s a 3.3% increase in its starting mass. The 0.2 mol solution of NaCl had a very slight negative correlation. From starting at 4.69g it decreases in mass down to 4.56grams, an overall loss of 2.7% of its original mass. It did not become flaccid although it is slightly less turgid than the chip in distilled water. The chips in the 0.6, 0.8 and 1.0 molar solutions all have a negative correlation, although the 0.8 mol solution results was not quite what was expected. Its mass percentage change is 0.6% above what was expected (About 9.3% decrease). By looking at the average percentage change graph against concentration of NaCl (hand drawn graph) it can be seen that the solution that the chips were bathed in prior to the practical was about a 1.5 molar solution of NaCl. This can be seen where the best fit line crosses the 0.0% change mark, showing that at that concentration the mass of the chip neither raise nor fell. These result fit very closely to what was predicted.
Analysis of Results:
The 0.0mol Concentration of NaCl: (Distilled water- water potential 100%)
Here the results show a positive correlation. This is because more free water molecules diffuse over the semi-permeable membrane of the cell. The chip should eventually stop swelling due to the concentration of free water molecules being equal on both sides and high internal pressure acting on the cell, preventing osmosis from occurring. Also due to this high internal pressure, the chip will feel turgid. There will be a higher concentration of free water molecules outside the cell wall to start with so, due to the laws of probability more will diffuse in to the cell than will diffuse out.
0.2 Concentration of salt in soil (chips stored in solution similar to this)
We can see that neither the mass, nor the turgidity (flexibility) decreased dramatically. It remained around the same for the entire practical. As there is, or should be an equilibrium between the concentrations of free water molecules between the inside of the cell and the solution as there chip has been bathed in a solution similar to this for a number of hours, therefore allowing the concentrations of free water molecules to even out by osmosis. There was, due to the fact that a similar number of free water molecules had diffuse into and out of the cell, no change in the flexibility of the chip.
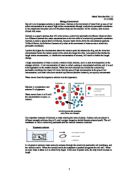
The concentrations of 0.4 (similar to the concentration of sea water that floods the plants), 0.6, 0.8 and 1.0 molar of NaCl all decreased in mass to slightly different degrees depending on the concentrations. The smaller concentrations decreased the least and the highest salt solution concentration, of 1.0 moles/litre had the highest mass loss. This rule applies for the turgidity of the chips as the lower concentrations will become only slightly floppier but the higher concentrations will become far more flaccid. The reason for this is that the higher the concentration of NaCl, the lower the concentration of free water molecules(water potential) will be so therefore the probability of water molecules entering the chip is low but the chances for molecules crossing out of the chip through the membrane is higher. As the concentrations of the salt solution directly affect the concentration of free water molecule, and can be easily controlled and changed, that is the most important variable in the practical. The reason that the free water molecules concentrations are so important is that this affects the probability of a water molecule crossing the membrane to change the mass of the chip. The reason for this is that the membrane on the potato chips only has gaps large enough for individual water molecules to diffuse through and so if there is a high concentration of free water molecules, this process of osmosis will happen more often due to an increased chance that the molecules will diffuse as there are more of them that can fit through. With the high concentrations of salt solution and a low concentration of free water molecules then there is less of a chance that the molecules outside the cell will diffuse in and so there is a higher chance that the water molecules inside the cell will diffuse out, making a reduction in the mass of the chip. The entire prediction relied on the different concentration of free water molecules. The higher concentrations of solute have a lower value for the free water molecules as the water molecule has salt molecules bond to it so it can’t fit through the gaps in the potato’s membrane. Shown in the diagram below:
The graph to show the average mass against time, does not really show very well the differing changes in the masses of the chips as time passes as mentioned in the prediction about the different concentrations of NaCl giving different rates and overall changes in mass. On the following page is the difference in mass between when the practical started and the final value. The higher the value the more the mass has changed. As can be seen it shows a positive correlation from the negative change in mass all the way up to the largest loss of mass. This has proven the prediction that the loss of mass will change depending on how different the concentrations are from the chips original concentration it the concentration it is bathed in. The relationship between mass loss and concentration is fairly clear as the second graph “A Graph to Show how Mass Loss is Affected by the Concentration Difference” It can be seen that there is a clear positive correlation in both graphs which therefore shows that as the difference in concentration increases then the Mass loss increases. However from looking at the graph it is evident that the rate at which the mass loss changes decreases as the concentration increase in a linier way. The mass loss could be working towards a maximum value which is represented in the living cell as Plasmolysis where the cell cytoplasm is no longer attached to the cell wall and so therefore the mass can’t decrease any more and there is no longer a sufficient amount o pressure being exerted no the cell wall so that osmosis can occur. This maximum value appears in the prediction and has been seen here in the results. Below are the graphs referred to above:
There also appears to be a large gap between two of the results where there is a sharp increase in the gradient and the mass lost. This is between the concentrations of o.1 and 0.3. This is the largest gap for this particular experiment as the value of the original chips were soaked in will, or should always be the smallest mass difference and so the mass difference here goes through the point straight into loss of mass from the positive change in mass. The loss of mass will eventually come to a plateau where there is a maximum concentration for the maximum amount of mass loss.
The results fit my expected patterns shown in the prediction but there are some minor outlying results in the main graph that the best fit line has ignore. These will be address in the evaluation of the practical.
Evaluation:
The actual practical procedure went very well as the 15 seconds for each reading was enough time for the reading to be taken except on occasions where the timing fell a little behind but was quickly made up. The scales gave seemingly accurate results throughout the practical. The evidence obtained from the tests was good as far as drawing conclusions is concerned and is fairly near to what I would have expected my “model results” illustrated in the plan to look like as getting perfect results is almost impossible. I think that the obtained results, especially the averaged out graphs, would be very accurate and reliable. Due not only to the repetition so that any problems could be seen but also due to the fact that checked my results with another person’s results (Kayer Patel) so that any mistakes or improper measurements could easily be seen.
Although the practical was generally good there were a few problems with the procedure. These may have caused my obscure result from the 0.8 molar solutions. In the higher concentrations of NaCl, towards the end of the practical, the chip went so soggy that it began to crumble, or decompose inside the tube and proceeded to start almost losing parts of it. This sogginess also led to problems extracting the chip with the mounted needle as it would often fall off of the needle. If the practical was to be done again it may be easier to use beakers to bathe the chips in instead of boiling tubes. The problem far more salt solution would be needed. Also the standard of drying was not really standardized between all of my experiments and this would be one point of focus for any repeats of the experiment that I would do in the future as the amount of solution on the chip would vary therefore having an effect on the overall results. The results would not be perfect as there were several other problems with the practical. However these can’t really be ironed out completely but can be kept to a minimum by care full measuring for examples. The problems with the practical are as follows:
- The chips are not all going to be all of the same size or mass and surface area and so therefore the results on the graph are going to be varied due to this. However the skin of the potato was removed as this skin is designed to prevent water loss and so would have a direct effect on the osmosis occurring in that chip. The chips, despite being all cut out of a regular sized cutter will not be precisely the same surface are and so therefore the rate of osmosis will be different. The chips may have been from different parts of the potato and different potatoes. However different potatoes may have different characteristics and so if possible it would be recommended that as far as possible all tests should be carried out with chips from the same potato.
- The temperature of the room is not controllable and a large increase in room temperature could speed up the water molecules and so more molecules have the chance to get through the membrane as there are going to be more molecules moving near it as they move faster and will reach all points of the container more.
However, despite these problems the practical produced fairly reliable results as can be seen in the graph.
There is however some odd results like the 0.8 mole solution this is marked in red circle on the percentage change graph (hand drawn graph). These were most probably due to human error or just the fact that the results were not actually prefect as they will never be in this practical. There is a possibility that the 0.8 mol solution was contaminated with another making it weaker. There will never be perfectly curved lines giving the perfect results obtained from a practical with lots of discrepancies between variables found in this practical which are shown above in the above criticism of the practical. There is almost always the problem of human error in these type of experiments, for example leaving the chips out of the water for too long or miss reading the balances (however the chip was left on the balance for enough time for the measurement to settle) or just a simple miss calculation in the averages or in the recording of results could have a large effect on the outcome of the results. However simply checking through and re-calculating odd results should allow for the removal of most of human error from the practical. If the experiment is repeated again then the results are not likely to be exactly the same however if the variables remained the same including the size of the chip then the results should be around the same kind of patterns in the results.
Improvement to this practical could have been to pool all of the classes’ data into a database on a computer in the classroom by connecting balances to a central computer where the mass is automatically recorded on the database. Then an average could be found of the entire classes results and conclusions could easily been drawn from that as the wide range of data would remove most odd results thus making conclusions more obvious. Different variables could be tested out to try to find out in what ways other variables, for example chip size or solution temperature could be tested. This would allow more to be found out in the conclusion section form the results and so therefore the prediction may have been easier to prove. Another improvement to the test could be that a very concentrated salt solution could have been used, for example around 5 moles/liter in concentration and carry out the practical with that chip as well, just to see if there is a maximum amount of water loss that a potato chip can experience and to prove that eventually the mass loss will plateau out due to a lack of water molecules on one side of the objects, wither the solution or the chip. This would have helped to see if the chip will continue losing mass or stop water a while as predicted, This was not seen in the gathered results due to time limitations but this one chip could be left overnight or until lunchtime for example. Another chip could be left in the 0.0 (distilled water) concentration to see if the prediction that a chip will not go on increasing its mass but will stop due to a lack of water on the outside of it or an extremely high internal pressure, again this would help prove the prediction as a plateau was not reached in the results collected, not because ether isn’t one but because there was a lack of time.
Only these two concentrations need to be left as they are the far extremes of the ranges and so will represent all values above and below the original.