C6H12O6 + 6O2 6H2O + 6CO2 + 2880kJ
For glucose to be broken down in this way oxygen is essential. Therefore this process is called aerobic respiration.
However, if there is no oxygen available the organism will either suffocate or use a similar process called anaerobic respiration. This involves sugar being broken down and energy being released without oxygen.
Yeast also respires anaerobically by converting sugar into ethanol (alcohol) and carbon dioxide gas:
Glucose Ethanol + Carbon Dioxide + Energy
C6H12O6 2C6H5OH + 2CO2 + 210kJ
This process is called alcoholic fermentation. The amount of energy produced in anaerobic respiration is significantly less than in aerobic. In aerobic respiration the sugar is broken down completely; in anaerobic respiration sugar is only partially broken down and there is a lot of energy still locked up in the ethanol. Burning some ethanol can show this – the energy in it is then released as heat. Though inefficient, alcoholic fermentation is a useful way of obtaining energy when oxygen is scarce. In this investigation, the yeast will be respiring anaerobically since it is not exposed to oxygen.
Fresh yeast has a similar appearance to putty. But it is really a fungus consisting of millions of tiny living cells. A number of these cells are zymase enzymes that use the glucose during anaerobic respiration to form energy and the other waste products. Being a typical enzyme, the zymase functions more effectively under different conditions. One of the factors that have an effect on the rate at which the zymase converts the glucose into carbon dioxide and water is temperature. This is the factor I am investigating.
Wild yeast grows on the surface of fruit, feeding on sugar. In the right conditions it multiplies rapidly by budding; a small bump protrudes from a parent cell, enlarges, matures, and detaches. A few yeasts reproduce by fission, the parent cell dividing into two equal cells. Many cells can be formed in a short time.
Yeast has been used for centuries in making alcohol and bread.
Prediction: As explained above, temperature is one of the factors that affect the rate at which the zymase enzyme converts glucose into carbon dioxide and ethanol. Therefore to make a suitable prediction, we must consider the properties of enzymes.
Enzymes are biological catalysts. They speed up the chemical reactions that occur in living things. The following points list the five important properties of enzymes:
- They are always proteins
- They are specific in their reaction
- They can be used over again
- They are sensitive to pH
-
They are destroyed by heat – this is because enzymes, being proteins, are denatured by heat. Most enzymes stop working if the temperature rises above approximately 45oC.
Based on this and point 5. above, the zymase enzyme functions slowly at lower temperatures and faster at higher temperatures – this can be explained by the collision theory. At high temperatures the glucose molecules are moving more quickly. They collide with each other and the enzyme more frequently, causing more successful reacting collisions. The opposite is true at lower temperatures where the particles move slower and less successful collisions occur.
Therefore I predict that respiration will occur more quickly at higher temperatures and more bubbles will be counted as the temperature increases because carbon dioxide bubbles are formed at a faster rate. At roughly above 45oC little or no bubbles will be counted – this can be explained by the nature of the zymase enzyme. The enzyme will reach an optimal functioning temperature, where the greatest amount of respiration occurs. This will be approximately 45oC. If this temperature is exceeded the bonds holding the enzyme together are broken, meaning that the enzyme can no longer function properly. At this point the enzyme becomes denatured.
A line graph can also be predicted to show what the results may resemble when plotted:
Bibliography: I obtained information for this investigation from the following secondary sources:
- Biology For Life text book by M.B.V. Roberts
- Britannica.com web site
- Microsoft Word 2000 – word processing resource
Results: The results of the investigation are shown in the table below. The average bubble count was calculated using the following equation:
(Test 1 + Test 2 + Test 3 + Test 4 + Test 5) / 5 = Average bubble count
Analysis: The results of my experiment show that higher temperatures up to a point somewhere between 45oC and 50oC, where all respiration stops, increase the rate of yeast respiration.
My results can be presented in simple line graphs, with temperature (oC) on the ‘x’ axis and number of carbon dioxide bubbles produced through respiration on the ‘y’ axis.
When arranged in the line graphs it becomes apparent that my results for the experiments, excluding test 5, are significantly inconsistent. In an attempt to counteract this I calculated the average bubble count. This provided a fairly precise curve of best fit and straight line. From the graphs I am able to find the following trends and patterns in my results:
-
As the temperature increased the rate of yeast respiration increased, up to 45oC where a decrease in respiration began occur – this displays a direct positive correlation followed by a direct negative correlation.
- The rate of yeast respiration does not increase with temperature in a linear fashion. Instead a curve towards the ‘y’ axis (number of bubbles) is formed, meaning that the rate of respiration increases more rapidly at higher temperatures than at lower temperatures – this curve is called a ‘hyperbola’.
I am also able to use my graphs to estimate results:
For example, at 30oC I would expect the yeast to produce 16.5 bubbles through respiration in test 1, 15 bubbles in test 2, 27.25 bubbles in test 3, 21 in test 4 and 16 bubbles in test 5. For the average of all five experiments I would expect (16.5 + 15 + 27.25 + 21 + 16) / 5 = 19.15 bubbles to be produced, or between 19 and 20.5 from the average graph.
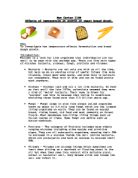
As the yeast respired it produced bubbles, which I counted during each individual experiment. The yeast respires to produce energy, which is used to maintain all its life processes, for example, growth, reproduction and digestion. The process is carried out in the yeast and glucose solution mix. The yeast to release energy, with carbon dioxide and ethanol produced as by-products, uses the glucose. This is shown in the word and symbol equations below:
Glucose Ethanol + Carbon Dioxide + Energy
C6H12O6 2C6H5OH + 2CO2 + 210kJ
Therefore I was counting the bubbles of waste CO2 produced.
The yeast is able to use the glucose to form energy and the other waste products through the use of an enzyme called ‘zymase’. Therefore it is the zymase enzyme that causes respiration to occur in the yeast and glucose solution. Being a typical enzyme, the zymase functions more effectively under different conditions. One of the factors that have an effect on the rate at which the zymase converts the glucose into carbon dioxide and water is temperature. The enzyme functions slowly at lower temperatures and faster at higher temperatures – this can be explained by the collision theory. At high temperatures the glucose molecules are moving more quickly. They collide with each other and the enzyme more frequently, causing more successful reacting collisions. The opposite is true at lower temperatures where the particles move slower and less successful collisions occur.
Therefore respiration occurs more quickly at higher temperatures, explaining why more bubbles are counted as the temperature increases because carbon dioxide bubbles are formed at a faster rate. At 65oC no bubbles are counted – this can be explained by the nature of the zymase enzyme. The enzyme reaches an optimal functioning temperature, where the greatest amount of respiration occurs. This temperature is 45oC in my experiment. If this temperature is exceeded the bonds holding the enzyme together are broken, meaning that the enzyme can no longer function properly. At this point the enzyme is said to be denatured. This explains why no bubbles are formed at 65oC in my experiment as the zymase has become completely denatured at this point.
My results strongly agree with the prediction I made earlier in the investigation, as the rate of respiration increased with temperature up to a certain point, 65oC, where respiration no longer occurred. Also, the rate of respiration did not increase in a linear fashion, but increased more rapidly before reaching an optimum temperature of 45oC.
Evaluation: The method I used in this investigation was simple, easy to repeat and of fairly high accuracy. However, I found counting the bubbles formed to measure respiration imprecise as is evident from the considerable fluctuation of my results. For example, at 45oC I counted 29, 28, 16, 27 and 30 bubbles for each test – a range of 14. I also believe that I obtained a wide range of results by using nine different temperatures, but I could have included 55oC to improve the accuracy of the curve.
I used 10ml syringes accurate to the nearest 0.1ml to measure the amount of yeast and glucose solution. A stopwatch accurate to the nearest 0.01 of a second was used to measure the 1-minute time intervals. I used a thermometer accurate to the nearest 1oC and used to measure the temperature of the yeast and glucose solutions. As stated before, the main inaccuracy in the experiment was met when counting bubbles to measure the rate of yeast respiration.
The results obtained in my experiment were not particularly consistent and several results stood out to be anomalous. For example, one obvious anomaly can be found at 45oC in test 3, where 16 bubbles were counted when compared to 29, 28, 27 and 30 in the other four tests. There is a possible reason for this anomaly – I may have shook the glucose and yeast solution too gently, causing a decrease in the amount gas bubbles produced. This may have occurred on several occasions and been the opposite in some cases – I may have shook the glucose and yeast solution too violently, causing an increase in the amount of gas bubbles produced.
Despite the several inconsistent results and the inaccurate way of measuring the amount of carbon dioxide gas produced, I would credit the method I used for being simple, safe and easy to repeat.
Two possible alterations that could be used to greatly improve my original method would include the following:
- Re-positioning the delivery tube into a measuring cylinder so that it could be used to collect the bubbles of gas. This would give an exact volume of gas produced by the respiring yeast. In would also reduce human errors caused by missing bubbles or counting extra bubbles – I found on a number of occasions that small bubbles were released from the delivery tube at the same time as the large and definite bubbles I had been counting.
-
Using a much smaller temperature interval between each reading, such as 5oC, and a wider range of temperatures, such as 0oC – 70oC, would give more consistent results that could help to improve the accuracy of the experiment.
As explained above, the only factors hindering the reliability of my evidence were the method of counting bubbles to measure the rate of yeast respiration, the fairly large temperature boundaries and the narrow temperature range. These factors all combined to give a smaller amount of results than could be obtained for a successful investigation.
I also found a strange pattern in my results table that did not related to the averages or the graphs. It showed a significant increase in the amount of bubbles produced on test 3 of each temperature, which rose by roughly 12 bubbles when compared to tests 1 and 2 that were quite similar. There is a possible reason for this pattern: after test 2 at each temperature the temperature of the yeast and glucose solution had fallen, so I reheated it back to temperature. Doing this must have re-acclimbatised the yeast and caused it to produce bubbles at an increased rate. However, once the temperature fell again after reheating, lower bubbles counts were obtained for tests 4 and 5, so averaging out the results.
The evidence I have obtained in this experiment is reliable enough to support the conclusion that the rate of yeast respiration increases with temperature up to 45oC, and then the zymase enzyme becomes denatured. However, I do not believe that the evidence is strong enough to support a numerical conclusion; such as if the temperature is doubled then the rate of respiration is doubled. More accurate experiments would need to be carried out before any reliable numerical conclusions could link the respiration rate of yeast and temperature.
A useful extension for this investigation would be to measure the rate of yeast respiration beginning from a temperature of 45oC and increase the temperature very slightly, for example, in 2oC or 3oC intervals, until respiration no longer occurred. This would find the approximate point where the zymase enzyme becomes denatured as well as the optimum functional temperature for the enzyme indicated by the highest respiration rate. Also, to further extend this investigation, I could examine another factor affecting yeast activity, such as the concentration of glucose or yeast solution.