through them. The water molecules pass both ways through the membrane but because
there’s more on one side than the other, there’s a steady flow into the region with fewer
water molecules. This causes the other region to fill up with water. The water dilutes
the concentration on either side of the membrane.
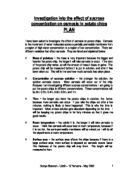
This is what I think my graph of results will look like:
(Predicted graph)
Osmosis does not
occur at this point
on the graph. The
mass does not change
either because the
concentration inside
and outside the chip
is balanced.
Apparatus:
I used various apparatus for my experiment. They are listed:
• Tile and scalpul – to cut the chips to size.
• Test-tube rack – so the tubes do not spill solution.
• Test tubes filled with solutions.
• stopwatch – to time the experiment.
• Paper towels – to dry the potato chips.
• Ruler – to measure the length of the potato chips.
• Potato borer – to cut potato chips out of the potato (5mm).
• Boiler tubes.
Preliminary work:
Before my final experiment, I decided to do some preliminary work to see what lengths, widths, times, and masses I would have in my final experiment. First of all:
• Length ~ I decided that I would cut the length of the potato chips to 4cm because I thought that this would be appropriate. It is not long and not too short.
• Width ~ We started by measuring the at 4mm but this looked like it was a little bit thin so I changed it to 5mm.
• Time ~ Time was important because osmosis occurred better with more time. First, I thought of leaving the chips in for 10 minutes but this seemed to be too short. Then I thought maybe 20 minutes would be okay, but then I thought it needed more time. Finally, I decided to try 40 minutes and thought that it was a reasonable time so I kept it to this.
• Results ~ Here’s what my results turned out to be in my preliminary work
From my results table, I decided to keep the time 40 minutes, keep the width 5mm, and keep the length 4cm because there is more time for osmosis to occur. Width affects osmosis because the wider the chip, the bigger the surface area, so osmosis occurs faster. The smaller the surface area, the longer it takes osmosis to occur. Length affects it for the same reason. I did not do it too long because I thought it would be difficult to get long chips because the potatoes are not always big.
I think that I did the experiment fine the first time and I don’t think I should change anything so I have decided to leave everything how it is except I’m going to have more molarity’s in the actual experiment.
Method
• First, I’ll get all my equipment together: Sucrose solution, water, potato, potato borer, scales, 6 boiler tubes, Test-tube rack, ruler, scalpul, tile, stopwatch, paper towels, thermometer, measuring cylinder, and a pipettes.
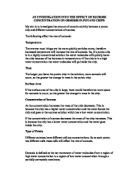
• Next, I will measure the different concentrations of the sucrose and put 0m in the first boiler tube, 0.2m in the second boiler tube, 0.4m in the third boiler tube, 0.6m in the fourth boiler tube, 0.8m in the fifth boiler tube, and finally, 1m in the last boiler tube.
This is how the concentrations were mixed:
(In a table)
• I will then cut out chips, using a potato borer. They will be 5mm thick and 4cm long. I will use a knife and a ruler to get my measurements exact.
• After doing that, I will rinse all the chips out and dry them with a paper towel. I will label each boiler tube with chip A, B, C, D, E and F.
• Then, I will measured each chip (in mass) and write down the measurements in a table like the one above. While doing this, I will measure and record the room temperature.
• I will get a stopwatch ready and drop the chips, (one in each tube) and start the timer. I plan to leave the chips for 40 minutes in the boiler tubes.
• After the whole 40 minutes have gone, I will remove the chips from the boiler tubes, take off the surface solution with a paper towel, and then I’ll weigh the chips making sure the scale reads 0.0g before I start – each time.
• I will do the experiment twice because I want to get the averages and I want to reduce the effect of anomalous results.
I think that this will be a fair test because I think I have thought of every possible variable and I will everything I can to make it as fair a test as I can. I will try to get the chips to go in and come out of the tubes at the same time.
For safety measures, I will wear a lab coat, wear safety goggles, and tie my scarf back. I will make sure I use equipment properly and not mess about with dangerous equipment that could cause accidents i.e. Scalpul.
OBTAINING EVIDENCE
All the potato chips are 4cm and 5mm. They were all kept in solution for 40 minutes.
The results were as follows:
First experiment: room temperature 20°C
Second experiment: room temperature 19°C
In both of the experiments, chip C and D floated to some extent; chip E floated to the middle of the tube, and chip F floated right to the top.
Average difference in mass:
0m ---- 0.08 + 0.08 = 0.16 ÷ 2 = 0.08
0.2m ---- 0.04 + 0.06 = 0.10 ÷ 2 = 0.05
0.4m ---- 0.03 + 0.05 = 0.08 ÷ 2 = 0.04
0.6m ---- 0.01 + 0.03 = 0.04 ÷ 2 = 0.02
0.8 ---- - 0.01 + - 0.01 = - 0.02 ÷ 2 = - 0.01
1m ---- - 0.01 + - 0.02 = - 0.03 ÷ 2 = - 0.015
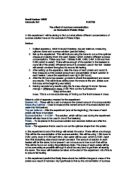
These results show that potato cells increase in mass when they are in solutions with high water concentrations and they decrease in mass when they are in solutions with low water concentrations. At concentrations just above 0.6m, it shows that there is no additional water loss. This suggests that the cell is fully plasmalysed.
ANALYSING EVIDENCE AND DRAWING CONCLUSIONS
My graph shows the results of my experiment. The line is the ‘line of best fit.’ It does not go through the origin. It means that the change in mass and the molarity of the sucrose solution are not directly proportional.
I found a pattern in my results that showed me that as the molarity of the sucrose solution increased, the mass of the chip decreased. The gradient changed as well. It got less steep as ‘X’ got bigger. This was because osmosis occurred from a low concentration to a high concentration and because the potato chip was trying to get as flaccid as it could, so the change in mass got less, as the concentration got higher.
All of my results are close to the ‘line of best fit.’ This shows that they are consistent. My graph also fits with my predicted graph.
In the boiler tube with the 0m concentration, there is no sucrose in that tube so the chip is more concentrated because the water moves into the chip by osmosis. However, the boiler tube with 1m concentrations had only sucrose in it with no water at all. It had more sugar than the chip did, so water moved out of the chip in order to get the concentration inside and outside the chip, equivalent.
From my experiment, I found out that the more sucrose (concentrated sugar) solution I use, the more the mass of the chip decreases. When the mass does not increase or decrease, (on the graph) it shows that osmosis has not occurred.
The prediction that I made was correct because I predicted that in one hundred per cent water, the potato chips would swell and increase in mass, because water would enter their cells by osmosis because starch was present and it was at a higher concentration than the water so, water moved into the chips. In the sucrose solution, the potato chips shrank and decreased in mass, because water left their cells due to osmosis because osmosis occurs when molecules from a low concentration move into a high concentration. The higher the concentration of the sucrose solution, the more water will move out of the potato chip. This is what happened. I also pointed out that on my graph, there would be a point on the graph where no osmosis will occur and there will be no change in mass. This also happened, because when osmosis was taking place, there was a point where sucrose in and out of the chip was balanced so osmosis could not occur and the mass did not change. Then, the mass started decreasing because there was more sucrose outside the chip rather than inside the chip.
EVALUATION
The experiment was easy because all the apparatus were out and all I had to do was to sort out what were we doing. It was quite fun. I liked it because we got messy and we were left to do everything on our own. I did not have any problems during the experiment, they were straightforward. It was important to get accurate results so I changed my mind about things a lot. Things like the width of the potato, started with a length of 7mm, then 3mm and then finally 5mm, where we left it. These changes were easy to make because first I did my preliminary experiment and so I could improve the things that needed changing for my actual experiment.
I could have had more boiler tubes and I could have taken more molarities, like 0.10m, 0.30m, 0.50m, etc. If I did this, I could have found the isotonic point by there being no change in mass. This would show the water potential of the potato and the result could be used further. I could have repeated it more, too. I could have also cut the potatoes into a different shape, doughnut for example, because the cells in the middle of the potato could have had a different capacity of water intake or distribution. If I had cut the potato into doughnuts, I would have only been using the out side of the potato, leaving out the middle.
My results did lie close to my line of best fit, and for that reason, they were quite accurate, but if I was doing the experiment, again I could make some other changes, some which are mentioned above. I could also use a burette to measure my solutions. This would ensure that I have an accurate amount of solution in each test tube. I could also weigh each chip on a more accurate scale, e.g. not to 0.00g but to 0.000g.
I did not get any anomalous results, but some results were not as close to the line as others were. This could have been caused by one of my six results not being accurate, it could changed the average by a lot. Alternatively, perhaps the potato chips were not cut accurately, or on that part of the potato, the cells did not loose or gain mass as good. My results did differ a lot for the same concentration.
I realised that different parts of the potato may not have been the same because chips of the same width and length were not the same weight. My results were reliable and none were ignored.
I could make my request for information, bigger by testing the change in mass with molarity by using something else like another vegetable, i.e. cucumber or carrots. Then I could see if osmosis occurs with the same patterns with any vegetable.
Sonya Shannon - Uddin - 10 Yamama - May 2002