The infiltration rate depends upon the size and number of air spaces between the soil partials and between the peds and other soil structures. Changing the porosity of the soil therefore alters the permeability of the soil.
Hypothesis
I would expect that grazing of animals especially cattle would compact the soil and break down the ped structure of the soil compacting the air spaces and so reducing the rate of infiltration and that cultivation methods such as ploughing improve the soil structure and increase the porosity so increasing the rate of infiltration.
The excessive use of heavy machines on particular areas such as tracks would seriously compact the soil structure and result in a serious reduction in infiltration rates.
Data requirements.
I will require from each location the average infiltration rates, the % vegetation ground cover, the number of plant species that are present, an observation of the level of soil compaction and a record of the general agricultural use of the land.
I will investigate 12 different locations, which are:
1 a storage area for round bale silage
2 a grass paddock that has been grazed over the winter
3 a potato crop
4 an area of spring barley
5 an area of winter barley
6 a heavily used dirk track
7 a recently ploughed field
8 an area, which has been set-aside for 1 year
9 grassland
10 an area, which has been set-aside for 10 year
11 a small oak wood
12 marshland
Fieldwork Schedule:
Saturday 6th to Sunday 7th research of Internet and of textbooks and investigation planning.
Monday 8th field recce to determine locations for analysis, and testing of equipment.
Tuesday 9th data collection from chosen locations.
Wednesday 10th to Sunday 14th analysis of data and completion of written report.
Risk assessment of fieldwork
The fieldwork is generally a safe activity and the risk is generally low. There are however certain risks and precautions that must be observed.
As the study is taking place on private farmland permission must be acquired from the owner. Information must also be obtained as to whether there has been any application of toxic chemicals to the area in question or whether the is going to be heavy machinery operating near by and also the location of potentially dangerous animals such as cattle.
This should prevent the risk of poisoning or serious injury from livestock/machinery.
It is also necessary to inform a family member/friend on the location and estimate time to complete the fieldwork. A mobile phone is a useful item but must not be relied upon, as reception can be poor. Fieldwork also has a risk of minor injuries such as sprained ankles from uneven ground.
Method of Data Collection
Primary data is the main source of data for the investigation and is obtained from the fieldwork. Secondary data that is required is the location and farm plan maps, the geological maps and the recent history of the field use from the farm records.
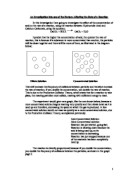
Use of measuring equipment.
The main data that is measured is the rate of infiltration. This requires an infiltration tube, which is made from a section of strong section of plastic drainpipe that measures 10cm in diameter and 30 cm in length. Also required is a 30cm ruler a stop watch a hammer a piece of wood and a source of water. Method for measuring the rate of infiltration; the infiltration tube is to be hammered into the ground to a depth of 10cm to prevent damage to the tube whist it is being hammered into the ground a piece of wood will be placed on the top of the tube. Once the tube is firmly in place and good seal between the tube and the soil has been achieved place the ruler in side the tube and pour water into the tube so that it is nearly full. The timer is to be started and the height of the meniscus above the ground is to be recorded. The height is then to be taken at minute intervals up to 4 minutes. To ensure greatest accuracy the initial height of the water should be maintained on each measurement taken.
The vegetation height is simply recorded be measuring the height above the ground. Percent vegetation cover can be observed with the aid of a quadrate place on the ground, this also enables the number of plant species to be recorded, it may be necessary to use a text book in order to identify different species, a although the species present are not being investigated. A measure of ground compaction can be given using a scale of 1-10 where 1 is the s=least amount of compaction, visual observations and the amount of force required to insert the infiltration tube will be required to give a figure for this measurement.
Sampling Methods
As the farm is not uniformly level it is not possible to take transects of the different land uses or to use a stratified approach. So it is necessary to choose areas which are relatively flat and have no features nearby be that might affect the results such as hedgerows or electric pylons. Once the area was chosen the quadrate was to be randomly places in 3 different spots by throwing it from the same spot in different directions. I felt it infeasible to create a grid and use a randomly generated numbers for areas, which have no uniform size or shape.
At each of the 12 different locations 3 of each sets of data were collected and average set of results generated.
Results
Table 1 shows the average rate of infiltration at each minute interval at each location.
Table 1
Table 2 shows the results of all the data collected at each location with the average infiltration rate at minutes 3 and 4. This is done because before minute 3 the rate of infiltration in most cases is decreasing this can be seen on graph 1, by taking the last 2 readings the accuracy is improved and a true rate of infiltration can be given.
Table 2
Graphs 2 and 3 compare the rate of infiltration to the level of soil compaction and the percent vegetation cover. In graph 3 the locations with bare ground were removed as the all have the 0% vegetation but because of their different compaction levels they have significantly different rates of infiltration.
Graphs 2 & 3
Analysis
Graphs 2 and 3 show that there is a relation ship between rates of infiltration and vegetation cover and soil compaction. In order to confirm the correlation of each sets of information and to create a significance of the correlation to the number of data points I used the statistical analysis called Spearman coefficient of correlation. This generates a coefficient, number known as rs, between +1 and –1 where 1 is a straight-line and 0 is completely random distribution of data points.
The formulae for the calculation is rs = 1-6Σd2/n3-n
Method: the 2 sets of data are first rank so that the highest value has the highest rank, the difference between the 2 ranks for each location is then calculated. This refers to the letter d in the above equation. The letter n refers to the number of pairs of data points.
The values are the entered in to the formulae to give the rs value.
Below are the tables of calculations used to create the rs values for graphs 2 and 3.
Analysis of graph 2
Analysis of graph 3
Graph 2 creates a value of -0.66084 which shows that there is a definite negative correlation between the rate of infiltration and the level of soil compaction. When this is compared to table 4 it gives a significance of 0.025, which means there is a 2.5% chance that the results were generated by chance. Graph 3 gave an rs value of -0.71429 again showing that there is a negative correlation between infiltration and the % vegetation. The higher number shows that the correlation is stronger and the graph more closely follows a straight line.
When referred to table 4 it gives a significance value of 0.05 showing that there was a 5% chance that it was generated by chance. Table 3 shows the level of infiltration sorted in ascending order and allows the comparison of different factors to be made.
Table 3
Conclusion
The most significant factor that affects the rate of infiltration is the level of soil compaction. Vegetation plays some role but it is difficult to differentiate between varying vegetation rates and soil compaction as the soil compaction is related to the vegetation that has been planted.
From graph 2 it is clear that the level of soil compaction affects the rate of infiltration and the use of the land is the major factor affecting the level of compaction. The graph also shows 2 anomalies where the rate of infiltration is low while the soil compaction is high. This can be explained because the areas where these were taken were the marshland and the long term set aside. The marsh land was expected to have a low rate of infiltration because of the deposition of clays and silts by flooding have created a soil which has a greater % of clay and silt which reduces the spaces between soil particle which lowers the rate at which water can infiltrate the soil. It was also observed that the ground had a higher water content, which also reduces the rate of infiltration. The area of 10 year set aside was also noted to have higher water content. The reason for this is not so apparent but it could be related to a possible greater depth of an organic layer, which may help to retain water and slow the rate of infiltration.
The graph did follow the hypothesis that was made.
Graph 3 however did not follow the hypothesis that vegetation would increase the rate of infiltration. It in fact was the opposite of this. There are a few explanations for this, the increase in vegetation cover and therefore density of a root system would result in a laver of vegetation that would create a barrier impeded the rate of infiltration or the vegetation cover is linked to the level of compaction as areas of low vegetation levels have been tilled most recently and therefore there has been less time for compaction to occur or the vegetation could be responsible for drying out the soil leading to compaction. There had been very little rain in the past weeks, which could have lead to the formation f a hardened and impermeable crust.
Table 3 shows the ranked data and from that it can be observed that there are no apparent trends between the number of species present or vegetation height and the rate of infiltration.
The locations with the highest rates of infiltration were the potato ground followed by the woodland then the ploughed area. The potato ground has the highest rate because it is heavy cultivated to create a very loose soil structure for potatoes to grow in the high rate of infiltration would help to explain why it is necessary to frequently irrigate this land to maintain potato growth. The woodland has a high infiltration rate because there is a significant layer of loose litter and there is little compaction because no vehicles use this area.
The areas of lowest infiltration were the marshland because of the increase in clay and the track because of the extreme level of compaction by tractors. This explains why erosion is significant in such areas because there is little or no infiltration resulting in a great deal of runoff.
Evaluation
The spearman statistical analysis shows that the results that were achieved had a reasonable significance level and it is unlikely that they were generated by chance. The determination of the rate of infiltration was accurate but the level of compaction was highly subjective and produced only an estimate. There are several other factors, which could be investigated in order to extend this investigation. These could concentrate on the soil structure and profile. This would require the drilling of core samples. the amount of water and organic matter could be investigated with the help of a laboratory. The investigation could also be extended to other farms to show the different affect on different soil and bedrock types. The effect of recent rainfall could also be investigated.
Bibliography
Geography for AS, By Clive Hart, 2000
Geography An Integrated Approach, David Waugh, 1990
Problem Solving Geography, Normam Law, David Smith, 1993
, aerial photos and Os maps
geological maps