Investigation into the factors which affect the rate of catalase action.
Investigation into the factors which affect the rate of catalase action
Catalase is an enzyme found in the cells of many organisms, both plants and animals. It speeds up the breakdown of hydrogen peroxide (a highly toxic chemical produced in small quantities in cells as a by-product of metabolism) to water and oxygen.
I was asked to investigate the effect of one factor on the rate at which catalase works. I will be using celery as the source of the catalase.
Planning
Enzymes are biological catalysts. They are produced in all living organisms and control all the chemical reactions that occur. There are 4 things that can affect the rate of the chemical reaction: temperature, pH, concentration of substrate and concentration of enzyme.
When the temperature increases, the rate of reaction will increase because as the temperature is higher, the kinetic energy of the particles increases, then more pairs of particles will have enough energy between them to collide successfully. Also, because heat is given, it provide another source of energy to get the reaction started, so that enough molecules reach the activation energy and collide successfully which cause the reaction rate to increase. But if the temperature is too high (above 50 c), the enzyme will denature and stop working because the shapes of the enzymes can no longer combine with the substances.
Any change in pH affects the ionic and hydrogen bonding in an enzyme and alters its shape. Extremes of pH will denature some enzymes. Each enzyme has an optimum pH at which its active site best fits the substrate. But most enzymes will work best in neutral condition (pH 7).
When there is an excess of enzyme molecules, an increase in the substrate concentration, produces a corresponding increase in the rate of reaction.
If there is an excess substrate, an increase in enzyme concentration will lead to a corresponding increase in rate of reaction.
Concentration of substrate or enzyme increases, the greater the rate of reaction will be because higher concentration means a higher number of particles in a given volume. If there are more particles, there will be more reaction. More reaction means a larger number of successful collisions. Therefore the reaction rate will increase.
But if the substrate is in short supply, an increase in enzyme concentration has no effect. Or if there are sufficient substrate molecules, the rate of reaction is unaffected by further increases in substrate concentration as the enzymes are unable to break down the greater quantity of substrate.
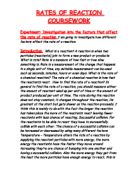
I think I am going to design an experiment to investigate the effect of concentration of substrate on the rate of the reaction. The experiment is going to be how can the concentration of the hydrogen peroxide affects the rate of catalase reaction.
I predict as the concentration of the hydrogen peroxide increases, the rate of catalase reaction will increase. This is because higher concentration means there is a higher number of particles in a given volume. If there are more particles, there will be a bigger chance of reaction occurring. Bigger chance of reaction occurring means a bigger chance of successful collisions. Therefore the reaction rate will increase. To find out whether when prediction is right, I am going to do an experiment.
Preliminary experiment
For my experiment, I will need:
- A 50cm conical flask with a bung
- A burette
- Container
- Delivery tube
- Clamps and stand
- 10cm measuring cylinder
- A stopwatch
- 20 vol of hydrogen peroxide
- celery juice (catalase)
Safety control
- I have to make sure all the school bags and chairs are under the table, in case I trip over
- I have to wear goggles, prevent any accidents that can damage my eyes
- I ...
This is a preview of the whole essay
Preliminary experiment
For my experiment, I will need:
- A 50cm conical flask with a bung
- A burette
- Container
- Delivery tube
- Clamps and stand
- 10cm measuring cylinder
- A stopwatch
- 20 vol of hydrogen peroxide
- celery juice (catalase)
Safety control
- I have to make sure all the school bags and chairs are under the table, in case I trip over
- I have to wear goggles, prevent any accidents that can damage my eyes
- I have to make sure I handle all the glassware carefully
- I have to handle the hydrogen peroxide very carefully because it is very toxic
Method
. Set up the experiment according to the diagram
2. Measure 10 cm of catalase (celery juice)
3. Measure 10 cm of Hydrogen Peroxide
4. Pour the catalase into the conical flask
5. Fill the burette with water
6. Pour the hydrogen peroxide into the conical flask and close the bung and start the timer
7. Record the volume of gas given off every 10 seconds (10s, 20s, 30s, 40s, 50s, 60s and 70s)
8. Mix hydrogen peroxide with pure water to give the following percentage of concentration of acid: 100%, 80%, 60%, 40% and 20%
9. Repeat 1 - 8 using the 100%, 80%, 60%, 40% and 20% hydrogen peroxide
0. Repeat the whole experiment twice to get a more accurate result
Diagram
Results
Time (seconds)
0
20
30
40
50
60
70
Volume of gas collected when there is 100% of H O (cm )
8.3
2.1
5.4
7.9
20.2
22.5
24.5
Volume of gas collected when there is 80% of H O (cm )
7.9
3.1
5.1
7.2
9.5
21.4
23.1
Volume of gas collected when there is 60% of H O (cm )
4.5
7.5
0.5
3.3
6.9
8.5
20.0
Volume of gas collected when there is 40% of H O (cm )
2.8
5.4
8.0
0.8
2.8
4.9
7.0
Volume of gas collected when there is 20% of H O (cm )
.0
2.1
2.9
3.6
4.7
5.6
6.3
The results show that I have used the right amount of catalase and hydrogen peroxide as the volume of gas given off at a rate that is not too quick. Also, the apparatus I chose are appropriate which can give me a precise result. I will repeat the experiment three times to give a more reliable result.
I will make sure the test is fair by:
) Checking whether I have too many catalase or hydrogen peroxide because this will affect the concentration of the substrate
2) Using the same celery each time to get the catalase because different celery may contain different amount of catalase which will then affect the concentration of enzyme
3) Putting the bung on as quickly as possible in case any gas leak out which will affect the accuracy of the experiment
4) Varying the concentration of substrate only each time, or else the results will not be reliable
5) Making sure the temperature remains constant as it will affect the rate of reaction. When temperature increases, the rate of reaction will increase
6) Making sure the pH remains constant as it will affect the enzyme. The enzyme works best at pH 7
Now I am going to plan my experiment again to get a more reliable and accurate result.
Apparatus
- A 50cm conical flask with a bung
- A burette
- Clamps and stand
- Delivery tube
- Container
- 10cm measuring cylinder
- A stopwatch
- 20 vol of hydrogen peroxide
- Celery juice (catalase)
Safety control
- I have to make sure all the school bags and chairs are under the table, in case I trip over
- I have to wear goggles, prevent any accidents that can damage my eyes
- I have to make sure I handle all the glassware carefully
- I have to handle the hydrogen peroxide very carefully because it is very toxic
Method
. Set up the experiment according to the diagram
2. Measure 10 cm of catalase (celery juice)
3. Measure 10 cm of Hydrogen Peroxide
4. Pour the catalase into the conical flask
5. Fill the burette with water
6. Pour the hydrogen peroxide into the conical flask and close the bung and start the timer
7. Record the volume of gas given off every 10 seconds (10s, 20s, 30s, 40s, 50s, 60s, 70s and 80s)
8. Mix hydrogen peroxide with pure water to give the following percentage of concentration of acid: 100%, 80%, 60%, 40% and 20%
9. Repeat 1 - 8 using the 100%, 80%, 60%, 40% and 20% hydrogen peroxide
0.Repeat the whole experiment three times to get a more
reliable result
1.Plot graphs for each concentration -volume of gas collected against time
12.Draw best-fit lines
Diagram
Analysis
After I have done the experiment, I have got the results:
st result
Time (Seconds)
0
20
30
40
50
60
70
80
Volume of gas collected when there is 100% of H O (cm )
9.4
4.7
8.6
20.5
22.9
24.7
/
/
Volume of gas collected when there is 80% of H O (cm )
6.3
0.4
2.5
5.4
8.4
21.2
23.5
/
Volume of gas collected when there is 60% of H O (cm )
4.7
7.6
9.5
2.0
4.2
6.2
8.3
20.1
Volume of gas collected when there is 40% of H O (cm )
2.2
4.3
6.1
7.8
9.5
1.2
2.8
4.5
Volume of gas collected when there is 20% of H O (cm )
.5
3.0
4.5
6.6
8.1
9.8
1.0
2.4
2nd result
Time (Seconds)
0
20
30
40
50
60
70
80
Volume of gas collected when there is 100% of H O (cm )
9.5
1.3
3.8
5.6
7.5
9.4
21.2
23.9
Volume of gas collected when there is 80% of H O (cm )
4.5
7.4
1.0
2.6
4.7
6.1
9.3
21.0
Volume of gas collected when there is 60% of H O (cm )
3.4
6.3
8.0
0.8
4.1
6.1
9.3
21.0
Volume of gas collected when there is 40% of H O (cm )
2.5
4.1
6.1
7.8
9.6
1.0
2.6
4.1
Volume of gas collected when there is 20% of H O (cm )
.0
2.0
2.8
4.0
5.2
6.9
8.0
9.0
3rd result
Time (Seconds)
0
20
30
40
50
60
70
80
Volume of gas collected when there is 100% of H O (cm )
0.8
3.0
5.2
7.2
9.4
21.8
22.9
23.5
Volume of gas collected when there is 80% of H O (cm )
4.8
9.8
3.5
5.0
7.0
8.6
20.3
22.6
Volume of gas collected when there is 60% of H O (cm )
4.5
6.1
1.0
3.8
6.0
8.0
9.5
22.0
Volume of gas collected when there is 40% of H O (cm )
3.3
5.5
7.0
8.8
0.2
2.2
3.8
5.3
Volume of gas collected when there is 20% of H O (cm )
2.0
2.9
3.8
4.4
5.2
5.9
6.7
7.5
Average result
Time (Seconds)
0
20
30
40
50
60
70
80
Volume of gas collected when there is 100% of H O (cm )
9.9
3.0
5.9
7.8
9.9
22.0
23.0
24.1
Volume of gas collected when there is 80% of H O (cm )
5.2
9.2
2.3
4.3
6.7
8.6
21.0
22.9
Volume of gas collected when there is 60% of H O (cm )
4.2
7.6
9.5
2.2
4.8
7.2
8.9
20.7
Volume of gas collected when there is 40% of H O (cm )
2.7
4.6
6.4
8.1
9.8
1.5
3.1
4.6
Volume of gas collected when there is 20% of H O (cm )
.5
2.6
3.7
5.0
6.2
7.5
8.6
9.6
Now I am going to draw the graphs - volume of gas collected against time. The graphs shows a curve best-fit line that means whenever the concentration increases, the volume of gas that was collected in the given time increases but the volume of gas collected increase at a slower rate at the end. The 100% concentration produced the most oxygen in the shortest time, which gives it a higher reaction rate than the others. According to the graph, it has proven my prediction is correct. The highest concentration would produce the most oxygen in the shortest time. The volume of gas collected increases at a slower rate at the end because the towards the end, there are less substrate and enzyme left, so it takes longer to react and releases the gas(oxygen).
The rate of reaction is a measure of how fast the reaction takes place. A reaction will take place when the particles of the reacting substances collide with each other and a fixed amount of energy called the activation energy is reached. If a collision between particles can produce sufficient energy (i.e. if they collide fast enough and in the right direction) a reaction will take place. This is called the Collision Theory for rates of reaction.
Concentration of the substrate increases, the greater the rate of reaction will be because higher concentration means a higher number of particles in a given volume. If there are more particles, there will be more reaction. More reaction means a larger number of successful collisions. Therefore the catalase action rate will increase.
Also, the particles are closer together, so they can collide more often. The more often they collide, the chance of reaction happening increases. So the catalase action rate increases.
Evaluation
I think the results are very good that I can use them to support what I predicted at the beginning. I also have enough evidence to support my conclusion. The points on my graph are not very close to the best-fit line which is due to the large scale I used, so the gap seems to be bigger. But the points let me draw reasonable best-fit lines and they also show the pattern I expect. I think I can still rely on the results because they show the general pattern for each concentration. I know my results are reliable because they fitted my prediction and it also enables me to explain the relation between concentration and rate of catalase reaction. Also, I repeated my experiment three times to obtain the results, so I know they are reliable. The appropriate apparatus I used, increases the accuracy of the results. I think my experiment is quite successful as I can collect results that help me to draw some accurate graphs except there are a few anomalous points. I think this happened because:
) I did not close the bung quick enough and some gas leak out which cause a decrease in the readings
2) I did not use the same celery each time because 1 celery does not provide sufficient catalase for the whole experiment which can cause increase or decrease to the readings
3) The temperature is slightly different as I did the experiment in three different days which can cause increase or decrease to the readings
I think there is a better way of doing it that is to have a tap at the top. When I open it, the hydrogen peroxide will drop down into the catalase and I do not need to put the bung on because the bung is put on top of the tap which means no gas will leak out. Also, when I time it with a stopwatch, it will not be as accurate as using computers to time because human has reaction time that will increase the time taken and this will make the experiment less accurate. I can do the experiment in this way:
For this experiment, I have used celery as a source of catalase, other than this; I can use potatoes or liver that may affect the time taken to collect gas, as they are different.
Further experiment
Planning
Apparatus
- A 50cm conical flask with a bung
- A burette
- Clamps and stand
- Delivery tube
- Container
- 10cm measuring cylinder
- A stopwatch
- 20 vol of hydrogen peroxide
- Potato tubes (catalase)
Safety control
- I have to make sure all the school bags and chairs are under the table, in case I trip over
- I have to wear goggles, prevent any accidents that can damage my eyes
- I have to make sure I handle all the glassware carefully
- I have to handle the hydrogen peroxide very carefully because it is very toxic
Method
. Set up the experiment according to the diagram
2. Measure 10 g of catalase (potato juice)
3. Measure 10 cm of Hydrogen Peroxide
4. Pour the catalase into the conical flask
5. Fill the burette with water
6. Set up the light sensor and the computer
7. Turn on the tap and start the computer at the same time
8. Record the volume of gas given off every 10 seconds (10s, 20s, 30s, 40s, 50s, 60s, 70s and 80s)
9. Mix hydrogen peroxide with pure water to give the following percentage of concentration of acid: 100%, 80%, 60%, 40% and 20%
0.Repeat 1 - 9 using the 100%, 80%, 60%, 40% and 20%
hydrogen peroxide
1.Repeat the whole experiment three times to get a more
accurate result
2.Plot graphs for different concentration- volume of gas
collected against time
13.Draw best-fit lines
14.Analysis results