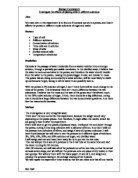
Concentration of the solution-Osmosis is the net water movement from a less concentrated solution to a more concentrated solution, through a partially permeable membrane. To study the effects osmosis has on the potato I will have to change this one variable and observe the outcome.
I predict that the slices of potato in the solution with no salt in, will gain more mass than the slices in the other solutions. This is because this solution has the least concentration of salt in it and the water movement goes from a lower solute concentration to a higher solute concentration. So as the solutions become more concentrated I believe they will stop gaining mass and begin to loose mass as water molecules are drawn out.
5. Results to be recorded
I will cover a wide range of five results in order to provide enough evidence to give a trend or pattern and form a strong conclusion. Each result will be repeated three times with different sized slices so that I can check my reliability and spot any odd results, which can be ignored.
6. The Science behind the Strategy and Prediction
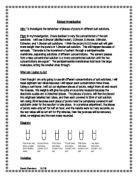
Osmosis is the net water movement from a less concentrated solution to a more concentrated solution through a partially permeable membrane.
The diagram shows the higher concentration of salt cells within the potato cell; outside the cell there are fewer salt cells and a lower concentration. The water molecules from the lower concentration out side the cell are drawn across the partially permeable membrane – the cell membrane – to the interior of the cell where there is a higher salt solution causing an increase in mass. This is happening in each cell on the surface of the potato in this experiment. This diagram illustrates the situation with the 0.5 molar solution, as the higher molar concentrations are used the situation would be gradually reversed until water is being drawn out of the cells resulting in a loss of mass from the potato.
If I start with plain water I would expect water molecules to be drawn into the potato leading to an increase in mass, as I use increasingly concentrated solutions the concentration of salt molecules outside the potato will increase resulting in water molecules being drawn out and a resulting loss of mass. However, at some point the solution out side the potato should be of a similar concentration to the potato itself, in this case very little movement of water molecules would occur resulting in very little change in mass.
Using a wide range of results will allow me to collect enough evidence to look for a pattern which will allow me to make a sensible conclusion. If I only used one set of results it would be hard to identify anomalies which might lead to misleading conclusions.
In order to achieve accuracy I shall use a stop watch to time how long the potatoes are left in the solutions. I will use an electronic balance ensuring that it is set to zero between each weighing and subtracting the mass of the paper towel under the sample. When measuring the solutions into measuring cylinders I will check the amounts at eye level, trying to obtain a similar perspective each time. When slicing the potatoes I ensure that they are accurately weighed before use ensuring that they are all of similar mass (though to a certain extent the affect of this is lessened as I am attempting to obtain percentage changes rather than actual change in mass though the differences in the surface areas of the samples could affect the results).
I will record my technique for carrying out this experiment in sufficient detail to allow another person to be able to carry out a similar experiment and hopefully obtain similar results.
The results I record will help me to see how much mass has been gained or lost in the potatoes and how the five different concentrations have affected the potatoes. My results will also help me work out a percentage change. I will then be able to see how the osmosis has affected the potato slices. This is all aimed at testing my prediction.
7. Preliminary work and secondary sources
Prior to this experiment I did do a preliminary practical that helped me to decide which molar solutions to use. In this preliminary practical I used distilled water, 0.5 molar and 1.0 molar solution. This made me realise that I had to go a bit lower down to 0.20 rather than 1.0 and put some other different solutions in-between them because there was too big a gap between the results which although they showed a rough pattern did not show the gradual increase and decrease in mass which I predicted.
From secondary sources I found that osmosis does not just simply occur in salt and water solutions, it can occur in sugar solutions and many others. ‘One important example of osmosis is water entering the roots of plants. If animal cells such as blood cells are placed in different strength solutions they will swell up or shrink depending on whether they gain or lose water via osmosis.’ ( extract from ‘Collins study and revision guide’ for science).
Section B. Obtaining Evidence
- Safety
2. Results Table
The results underlined are odd results and were ignored in the average graph.
Section C. Analysing Evidence and Drawing Conclusions
1. Summary
From the data which I have recorded I have found out that with low molar solutions the mass of the potato increases and with higher molar solutions the mass gradually decreases.
2. Results as graphs – (see graph paper pg )
The calculation I used to work out the percentage changes used in this graph was;
Difference in mass (g) x 100 =
Original Mass (g)
3. Trends
The basic trend which can be seen in this graph is that as the molar concentration increases the percentage change gradually changes from a gain in mass to a loss. This leads me to conclude that the lower concentrations were drawing water molecules into the potato cells whilst the higher concentrations were drawing water molecules across the partially permeable cell membranes out of the cells.
- Processing Results
The calculation I used to work out the percentage change was;
Difference in mass (g) x 100 =
Original Mass (g)
5. Graphs of Averages or Processed Results – (see graph paper pg )
6. Conclusions and Explanation
In this experiment, I believe that I have collected enough data to support my prediction. This investigation was, I think, successful. Successful meaning my results collaborated my predictions.
The potato cells took in, or gave out the water depending on the concentration inside the cells and the concentration of the solution it was surrounded with.
The results I recorded were good and with one exception fitted the original prediction. The graph of the percentage change in mass of the potato slices clearly demonstrates the notion of a concentration gradient, when the concentration outside the cell is weak water molecules are drawn in; when the solution is strong water molecules are drawn out. The resulting gains or losses of mass to the potato slices is easily seen. Osmosis is a special form of diffusion, in this experiment water molecules, which are constantly in motion, have a tendency to equalise the environment inside and outside the cell. As the cell membrane only allows the movement of water across it and not larger molecules such as salt or glucose any changes recorded to the mass of the potato slices are due to increased amounts of water either in the samples or in the solutions. One way of confirming this would be to accurately measure the amount of water left in the solutions at the end of the experiment as well as weighing the potato samples, however this would probably require more accurate measurement than was available to me at the time.
7. Comparing Prediction and Conclusion
The graphs I have included here do not show a line of prediction. Although I had a pretty clear idea what the results of this experiment would show I did not have sufficient information to make a real qualitative prediction. In order to do this I would have had to do more preparation work and time was not available for this. I could be reasonably certain that the potato samples would show an increased mass in weak solutions as waster was drawn in and a loss of mass in stronger solutions I could not predict precise changes in mass in terms of actual grams gained or lost.
The results I eventually obtained clearly supported my original predictions of mass gained and lost.
Section D. Evaluation
1. Procedures and Evidence Obtained
The whole procedure went very well without hardly any problems. It was quite an easy procedure that did not take too long though I had to wait thirty minutes while the experiment was taking place. The procedure suggested to me and which I followed allowed for quite a high degree of accuracy which is demonstrated by the clear results I obtained.
2. Quality of Evidence and Identifying Odd Results
The evidence I obtained was of a high quality throughout though there was one odd result. Though it was only slightly anomalous it proved to be a large percentage change compared with the other two so I decided to ignore it when producing the graph of averages. The repeats I recorded were all very similar, in most cases the increases or decreases were only one or two percentage points different from each other so they were very reliable.
3. Suitability of Procedure-Suggestions for Improvements
The procedure itself was very suitable and worked well enough to give me good results. The few improvements that could be made would be to use fifteen test tubes and put one potato slice in each instead of using five test tubes and putting three different sized slices in each. Changing this one factor may prove to get more reliable results and would also make the procedure simpler, though it may take slightly more effort and time to set up. Another improvement might have to been to pay more attention to making the samples exactly the same size as this could have had a slight influence on the results, the fact that my results clearly demonstrated the prediction shows that this had little influence but if I were doing this again I would improve this aspect.
4. Reliability of Evidence
I consider the results I recorded to be very reliable and certainly sufficient enough to support a strong conclusion accounting for one anomaly. The one anomalous result I recorded was only slightly odd but proved to be a large percentage change compared with the other two so I decided to ignore it when producing the graph of averages. This result probably occurred by not drying the potato slice sufficiently compared to the rest of them. The evidence I collected is sufficient enough to support a firm conclusion. Because all of the points are virtually on a straight line they are therefore reliable and there are enough to give a good clear pattern.
5. Further Work
To obtain even more reliable results and to support my conclusion more definitively I could record more repeats for each molar solution. I could also make more solutions, maybe five more to go with the five I have already got to make more precise results. If I was to do this experiment again I could use a cork borer to cut the potatoes into cylinders instead of cutting them with a knife into slices. This would make all of the potato pieces the same size that would make the experiment much easier instead of having a small, a medium and a large slice. With this I would put the potato cylinders into fifeteen separate test tubes that would make the experiment much easier to control and less confusing.