On the following page is a list of the equipment I will be using when I start my experiment.
Apparatus List
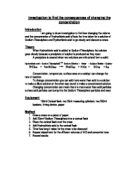
A short list of the equipment I will need to do this experiment.
- Jars of Hydrochloric Acid and Sodium Thiosulphate
- Two small pieces of paper with crosses drawn on in pencil
Method
To carry out this experiment, I will first gather together the equipment listed on the previous page, then (wearing the safety goggles at all times) I will use this equipment to help me do my experiment. I will also wash any recently used equipment to make sure nothing interferes with the experiment making it unfair and inaccurate.
I will fill a conical flask with 50cm³ of hydrochloric acid, making sure it is exactly 50cm³ by pouring the hydrochloric acid into a measuring cylinder before pouring it into the conical flask. I will then pour 50cm³ of sodium thiosulphate into the same conical flask with it, using the same methods. As soon as I do that, I will start the stopwatch and time how long it takes for the reaction to occur and for the solution to turn from clear and see-through to white and cloudy, I will stop the timer when I can no longer see cross that I have drawn on the piece of paper that I have placed beneath the conical flask.
Then I will do the same again. I will pour 50cm³ of hydrochloric acid into the conical flask (after washing it out from the first time I used it) but this time I will pour only 10cm³ of sodium thiosulphate and the remaining 40cm³ will be normal tap water. The reason I did not get rid of the sodium thiosulphate all together and just put 50cm³ of water was because if I did that the reaction obviously would not happen. So I kept it, but at a small amount.
I then time with the stopwatch how long it would take for the reaction to occur again. I made a note of all my results from this experiment in a table which is on the next page.
Results
These are my results that I got from the first experiment.
As you can see, these results tell me very little about what I was trying to find out. These results aren’t very accurate so I will have to do the experiment again with a few changes…
This time I will get the same equipment and do everything the same, except I will use a wider range of solutions, varying the amount of sodium thiosulphate and water used each time, more than before. I will also repeat timing each solution two more times after the first time, so that I have three different times to work out an average from. Apart from that I will keep everything else in the experiment the same.
Final Experiment Results
After doing the experiment a second time, this time with a few changes to help make it more accurate than before, I now have a second set of results below.
I took this data from the table and converted it onto some line graphs on the next page.
Conclusion
From these results which I got after doing my experiment, it is obvious to see that what I predicted would happen – happened. We can see on the table that the higher the volume of the sodium thiosulphate, the quicker the reaction takes place and the solution turns from clear to cloudy and it takes much longer when there is less sodium thiosulphate and more water in the solution. We can also tell this from the graphs that I drew, by the way the line moves straight from up to down on the graph.
Overall I am happy with how the experiment went and am glad that my prediction turned out to be correct. I made sure I did everything properly so I can assume these results are accurate. If I were to do the experiment again I would do mostly the same things as I have done this time but I would be more careful with how I draw on the cross on the piece of paper beneath the conical flask, in case one is drawn on darker than another one therefore staying visible for longer, which would affect my results as I would be stopping the stopwatch later.
So to conclude, I am happy with how the experiment went and I now have proof that my prediction before I did the experiment was correct, so it was a success.