The independent variable we are changing is the concentration of the sucrose solution. The range of concentrations is 0M, 0.1M, 0.2M, 0.3M, 0.4M and 0.5M.
Prediction
I predict that the size of the potato chip placed in the weakest solution will increase because all the water will move into the potato cells by osmosis. The concentration in the cells is much higher than the concentration on the solution. The size of the potato chip in the water will remain the same because both the concentration in the cell and in the solution will be the same. The size of the potato in the strongest solution will decrease because the concentration in the cells will be lower than the concentration in the solution. Therefore the water will move out of the cell.
I predict that at first the mass of the potato tissue will increase but,as the concentration of sugar in the solution increases past a certain point the mass of the potato cylinders will decrease.
Secondary Source Information
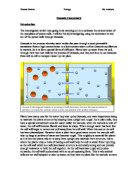
Osmosis
Some membranes in plant and animal cells allow certain particles to pass through them and not others. They are partially (or selectively) permeable.
The diffusion of water through a partially permeable membrane is called osmosis. The rate at which osmosis takes place is affected by the concentration of water in the two solutions on each side of the membrane.
If a partially permeable membrane separates the two solutions, water moves through it in both directions at the same time. However, more water leaves a dilute solution (high water concentration) and passes into a more concentrated solution (low water concentration) than enters it. Although the water appears to move across the membrane in one direction, it is in fact moving in both directions but more one way than the other.
When the concentration of water is the same on both sides of the membrane, the movement of water will be the same in both directions. At this point, the net exchange of water is zero and the system is in equilibrium. www.bbc.co.uk
Method
- Collect equipment
- Set out test tubes with relevant solutions
- Use the cork borer and measure out 4cm length of the cylindrical pieces of potato
- Record the mass of the pieces
- Place in test tubes with solution, at exactly the same time
- Start stop watch
- After 10 minutes drain out the liquid from the test tubes
- Dry excess water off the potato pieces
- Record the masses
- Fill in table
-
Repeat steps 2 -> 9 x 3
- Work out averages
- Plot your results on a graph.
Fair Test
- Keep volumes the same
- Keep temperature constant
- Use new potato pieces each time
- Check reliability of equipment
- Dry potatoes – remove excess water
- Same apparatus
- Keep the mass of the potato pieces similar
Preliminary Experiment
- Place in solutions of 0.1 M, 0.4 M and 0.5 M
- Immersed in solution
- Left for 10 mins
- 2.5cm length
Results
We realised it wouldn’t be a vast change in mass but it is barely noticeable. For the final experiment we will leave them for 20 minutes so more osmosis can take place. We will also repeat the experiment 3 times and take the averages so our results are more accurate.
I was pleased with these results as they were consistent with my prediction and agreed with what I had already learned about Osmosis. They also showed trends that could later be expanded in my main experiment using a series of different concentrations.
Results
3 Sets of results.
Average % worked out.
Graph drawn using average % of each solution.
To work out the percentage loss:
Divide the ‘change in mass’ by the ‘mass at start’
Then times that by 100
© ÷ (s) x 100 = % change
Evaluation
The experiment was very successful in my opinion. I obtained a large quantity of results from which I was able to create an informative graph. I think I took easily enough results for the amount of concentrations I was using, and the time I used for the experiment to take place was long enough for sufficient osmosis to accur.
However, if I was to repeat the experiment I might well increase the time of the result to allow more osmosis to happen and possibly find out the saturation point of the potato slices. The range of concentrations was adequate but I would possibly create more concentrations if I repeated it so I would have more varied results
i.e. 0.05 M, 0.15M, 0.25M and so on, including the solutions we used originally.
The cutting of the potatoes was the most difficult part of the experiment as although I was recording my results by length, it could well have affected the surface area and so the overall rate of osmosis.
If I were to repeat the experiment I would possible have found a machine to cut the potatoes as it would ensure that all the potatoes would be identical – same weight and dimensions. I could also weigh each piece on a more accurate scale e.g. 0.0000g or more.
There were not many anomalous results but some were not as close to the line as others. This may have been caused by human error. When the potato pieces were removed from the tubes and dried, we may well have dried some potatoes more thoroughly than others and therefore some would have more excess water that would add to the mass. I could find another way to dry the potatoes that would ensure that all were dried equally in future.
However, I am pleased with the outcome of the investigation and I think it was reasonably successful.