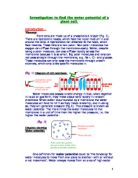
Patially permeable membrane
Water molecule
Solute molecule
(fig. 3b) The equilibrium of the two solutions.
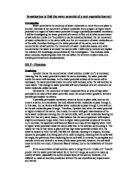
Pressure potential (ψp) is another factor that affects water potential. Plant cells have a very strong cell wall made up of cellulose. This means that if the cell were placed in distilled water, it would not burst (as would an animal cell placed in distilled water, because animal cells only have the double phospholipid or semi-permeable membrane with no cell wall).
So if a plant cell is dopped in to distilled water, water will begin to enter the cell because plant cells generally take up solutes from the soil through their roots, meaning the cell will have a lower water potential than the distilled water, and water will go down its concentration gradient. The plant cell will grow turgid exerting a pressure inside the cell (fig.4a). This is pressure potential and forces water back out of the cell. Because water potential is described as to move water molecules form one place to another, pressure potential must increase the water potential.
In a plant cell, the water potential can be expessed as the following equation: ψ = ψs + ψp
If the plant cell was placed in a concentrated sugar solution then water would be taken out of the cell, going down its concentration gradient. The cell will become flacid and the protoplast will pull away fom the cell wall causing the cell to be plasmolysed. The cell will not be damaged too much because the rigid cell wall will keep the cells shape (fig.4b).
(fig. 4a) A turgid plant cell. Cell wall- freely permeable
Plasma membrane- partially permeable
Cytoplasm
Tonoplast- patially permeable
Vacuole
(fig. 4b) A flacid plant cell.
Cell wall
External solution has passed throughthe cell
wall and is still in contact with the protoplast.
Protoplast has shrunk away from the cell
wall- the cell is fully polymolysed.
Vacuole
Cytoplasm
Osmosis is the process that water passes through the membranes of the cells. It can be described as ‘The movement of water molecules from a region of high water potential to a region of low water potential through a partially permeable membrane.’ The two diagrams, (fig. 3a & b) show how osmosis works.
Aim: -
The aim of this experiment is to find the water potential of a plant cell. By using the theory above, it can be possible to find the exact water potential by plotting a graph.
Prediction: -
As we have seen from the theory above, plant cells will allow water molecules to pass through the membane of the cell without trouble, but big molecules such as glucose, can not diffuse through the membrane. Water will go down its water potential gradient from a region of high water potential to a region of low water potential. Distilled water has a very high water potential at 0Kpa. Any solution with solutes in it make the water potential less e.g. a 1 molar solution of glucose has an osmotic pessure of –3500Kpa.
From all of this, we can make an accurate prediction to what we think will happen to the potato cells. When the potato cylinder is placed in the strongest 1 mol sugar solution, the potato cylinder will decrease in size and mass because the solution will have a lower water potential than the potato cylinder. This means that the water will move down its water potential gradient, in this case, out of the cell, into the solution. The cell will become plasmolysed until equilibrium is reached.
When the potato cylinder is placed in the pure, distilled water, the potato cylinder will increase in mass and size because the solution has a higher water potential than the potato cylinder. The fluid will enter the cell through osmosis going down its water potential gradient, until pressure potential inside the cell forces water back into the solution and equilibrium is reached.
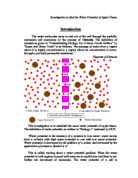
Between these two solutions will be the exact water potential of the potato cylinder. When it has reached equilibrium there will be no net movement of water and no change in size or mass in the potato cylinder. By drawing a graph, the exact water potential can be found. Fig. 5 shows what this graph may look like. We will change the solutions around by adding concentrations of either different amounts of distilled water to a 1 molar solution or different concentrations of solvent to distilled water. This means that it will be easier to plot the graph and find the exact water potential.
(fig. 5)
A table to show the variables that must be controlled.
This will be my variable in the experiment and I will change the concentrations of the solutions by using the information on page 6.
A table to show how the concentrations of the solutions can be made.
The concentations which are above are the ones which I will use in the test. I feel these will give me enough results to plot a graph and find the water potential of the potato cylinders.
I may have to make up the one molar solution in order to obtain the rest of my solutions. This can be done by taking the formula for glucose which is C₆H₁₂O₆. and from this I can work out the molecular mass and then from this, I can work out the amount of glucose in grams needed in a litre of distilled water which will make up a 1 molar solution:
C₆H₁₂O₆: = (12 x 6) + (1 x 12) + (6 x 16) =180
This means that 180g of glucose is needed to be added to a litre of distilled water to make a 1 molar solution.
Method: -
- Make up a 1 mol solution of glucose and then using distilled water, make up 0.25, 0.5 and 0.75 molar solutions of glucose.
- For each solution, measure out 20ml into three different test tubes and also 20ml of 1 mol solution and distilled water into a further two test tubes.
- Cut out 15 cylinders of potato using a cork borer, trim to 5mm in length.
- Record the weight of the potato cyliders to 2 d.p, in groups of three (making sure that these groups of three are put in the same solution) before putting them in the solution.
- Place the groups of three potato cyliders in the 5 solutions leaving 3 mins between each so that it gives me time to measure the weight for each set of potato cyliders when taken out of the solution, as shown in (fig. 6)
- Leave the potato cyliders in the solution fo 30 mins, timed with a stop watch.
- Take the potato cyliders from the solutions and then remove the excess liquid with a paper towel.
- Weigh the three potato cyliders from each solution to 2 d.p and record the figures against their starting weights.
- Calculate the difference in weight of the potato cyliders and plot these figures on a graph.
- Then read off the water potential of the potato from the graph where there is no weight change.
- Repeat the process three times in order to get an average, and to reduce the effect of an anomaly on the whole test.
Diagram of my apparatus: -
(fig. 6) Preparation apparatus:
A table to show my list of apparatus.
A table to show reasons for choice of apparatus.
Preliminary tests: -
In my preliminary test, I used the same sized potato cylinder, all weighing 0.5g. I put these potato cylinders into 5 solutions, 1 mol of glucose solution, 0.25, 0.50 and 0.75 mol of glucose solution and one of distilled water. Here are the results:
These results seem fairly reasonable although I was expecting to weights to change more considerably. This may be because I only left these samples in for ten minutes rather the thirty that I will do in the experiment.
I found using the cork borer a lot easier to use than I thought it would be, but cutting the cylinders with the scalpel to exactly the right length was hard. The concentrations that I have used are good and easy to make up. However, I feel they do not give me a wide enough range for the experiment, so I will use the following, 0, 0.2, 0.4, 0.6, 0.8 and 1 molar solutions. I think at least three tests will have to be done to get an average, if not more, so that anomaly can be recognised like the one in this preliminary investigation (highlighted).
A table to show how the new concentrations of the solutions can be made
Safety precautions: -
- Care most be taken with glasswear to prevent any breakages.
- Spillages of the solutions must be mopped up quickly.
- Care must be taken when using the sharp cork borer by using it on a hard surface like a tile.
- Care must be taken when using the sharp scalpel, and also using it on a hard surface like a tile.
- Attention must be given to the experiment at all times so that optimum results are obtained safely.
References: -
- Cambridge advanced sciences – Biology 1
- Biology – Martin Rowland.
- Advanced Biology – Principals & Applications.
- Biology dictionary – Alan Clamp.
I only used these sources as they are reliable. ‘The Cambridge advanced sciences – Biology 1’ was published by our exam board so must have the correct things for this examination. ‘Biology – Martin Rowland’ and ‘Advanced Biology – Principals & Applications’, are both from two different biologists but share the same content as in ‘The Cambridge advanced sciences – Biology’ 1’ but in more detail. This shows that they all link to each other in their content despite being written by different people so the information must be accurate to modern knowledge in the subject. The ‘Biology dictionary – Alan Clamp’ has many definitions which also appear to be the same in the other books so this source must be as reliable as the rest.