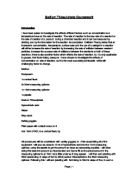
2.3 Activation energy
Activation energy is the energy that must be overcome in order for a chemical reaction to occur. It is essentially the minimum energy required to trigger the reaction. In this diagram (see Figure 3), (a) is the activation energy required for the reaction to take place whilst (c) is the energy change (known as enthalpy change). (b) is the activation energy needed for the reverse to happen. In an exothermic reaction the enthalpy change is always negative because the chemicals lose energy by giving off heat to their surroundings, whilst in an endothermic reaction the enthalpy change is always positive for the opposite reasons. The chemical reaction between sodium thiosulfate and hydrochloric acid is mildly exothermic.
Figure 3:
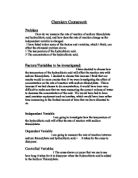
2.4 Factors
Increasing the concentration of the reactants and raising the temperature bring about more collisions and therefore more successful collisions, increasing the rate of reaction. However, the reason why each factor increases the rate of reaction is different. Increasing the concentration increases the likelihood of collisions occurring (see Figure 4) while increasing the temperature gives the particles more energy to move and collide (see Figure 5). Concentration is measured in molar (M) and temperature is most commonly measured in degrees Celsius (°C).
Figure 4: Figure 5:
The rate of gaseous reactions increases with pressure, which is equivalent to increasing the concentration of the gas. Pressure is measured in Pascal (Pa), equal to one Newton per square metre.
As only particles on the surface of reacting solids can collide, increasing the surface area of the solid increases the number of particles that are able to collide and therefore increases the rate of reaction. Surface area is measured in square centimetres (cm2).
When a catalyst is involved in the collisions between the reactant molecules, it reduces the activation energy required for the chemical change to take place; hence more collisions have sufficient energy for a reaction to occur. As a result, the reaction rate is increased.
3. PRELIMINARY WORK
3.1 Summary
As part of our investigation, we conducted a number of preliminary experiments. The purpose of these were to help us decide which parameter we would investigate and what equipment we would use in order to optimise our experiment and achieve reliable results.
3.2 Concentration or temperature
We conducted preliminary experiments for both concentration and temperature in order to help us decide which parameter we should investigate. Originally, we had planned to study the effect of varying the concentration on the rate of reaction because it was easier, quicker and simpler, meaning that we would be less likely to make human errors. However, our results clearly showed that the temperature experiment produced a greater spread of data across a range of temperatures (see graph 2), demonstrating collision theory. Meanwhile, the concentration experiment had a very small spread of data across a range of concentrations (see graph 1), showing that although concentration is one of the factors affecting the rate of reaction its impact is very small. We had confidence in our results because we had taken repeat experiments and plotted the averages. Therefore, we decided that for our full experiment we would investigate temperature.
3.3 Equipment
Apart from deciding which parameter to investigate, we also had to choose the equipment that we would need to carry out our experiments. To ensure that we carried out our investigation independently, we were not given a set list of equipment to use. Instead, we were given a wide range of equipment from which to choose the things we needed and told to use our preliminary experiments to choose the best suited equipment for the task. This included the choice between beakers and conical flasks in three different sizes as a container and different sizes of measuring cylinders. We could also choose the amounts of the chemicals we planned to use and were allowed optional equipment such as funnels for whatever purposes we saw fit for them. We chose a 100ml conical flask for a container because it was the only one in which the ‘X’ actually disappeared from view during the reaction (the other containers were too large and as a result their chemical layers were too thin). As for our measuring cylinders, we settled on 50ml for ease of use. At first, we were unsure which amount of chemicals would be best, so we tested them (see table 1). We agreed that we wanted a larger amount that would result in quicker reactions because we were very limited by the amount of time we had. Using 40ml of each chemical would have been ideal, but the school did not have that much available for everyone, so we decided to use 30ml of each instead. Another reason why we did not choose smaller amounts is because the ‘X’ did not fully disappear.
4. METHOD
4.1 Equipment
0.2L sodium thiosulfate (0.2M) @ 4°C, 23°C, 30°C, 40°C, 50°C and 60°C
0.2L hydrochloric acid (1.0M) @ 4°C, 23°C, 30°C, 40°C, 50°C and 60°C
1 × electric water bath
1 × container full of ice
2 × thermometer
2 × 50ml measuring cylinder
2 × funnel
1 × 100ml conical flask
1 × tile marked with an ‘X’
1 × electronic stopwatch
3 × safety glasses
4.2 Diagram
4.3 Procedure
This experiment is known as the disappearing cross experiment because the reactants in this reaction are transparent while the products are opaque (see Figure 6), causing the ‘X’ marked on the tile to disappear from view (see diagram above). This experiment provided us with a simple way of determining when the reaction was complete and could therefore be used to calculate the rate of reaction by measuring the time it took for the reaction to take place from when the chemicals were mixed to when the ‘X’ disappeared.
We conducted our experiment based on what we learned from our preliminary work. The equipment was set up as shown in the equipment diagram, with the water bath running at target temperature. Firstly, we would remove the chemicals from the water bath simultaneously and pour 30ml of each into their respective measuring cylinders using funnels, checking that we had exactly 30ml of each chemical before pouring them into the conical flask together, swirling it five times clockwise and finally setting it down. We would use the stopwatch to time from when the flask was set down to when the ‘X’ disappeared from view. Figure 7 shows the side and top view of the flask during this phase.
4.4 Fair test
If our investigation was to be successful we needed to make sure that we were not corrupting our results in any way. Therefore, while we tested the effect of a particular parameter on the rate of reaction between sodium thiosulfate and hydrochloric acid we ensured that all other factors remained constant. For example, when we were testing the effect of temperature, we used a constant 1.0M concentration of acid. Similarly, when we were testing for concentration, we used room temperature as a constant because it would not have to be monitored.
There were also simple things that needed to be considered, such as using the same amounts of all chemicals and taking repeat measurements in order to plot averages on graphs. We also used separate funnels and measuring cylinders for each chemical so that the sodium thiosulfate and hydrochloric acid would not become contaminated. Another problem with sodium thiosulfate is that it reacts with oxygen in the air, meaning that we had to keep it sealed until the last minute and then carry out the experiment as quickly as possible. Finally, when carrying out the experiments at the higher temperatures, the water bath was set to heat the chemicals to a few degrees above the target temperature to account for the fact that they would lose some heat when we took them out.
4.5 Safety precautions
When carrying out experiments, there can be a number of safety hazards. Concentrated hydrochloric acid is extremely corrosive and releases hydrogen chloride vapour which is toxic if inhaled. Furthermore, sodium thiosulfate can irritate the eyes and lungs (see Figure 8). We were also at risk from burning ourselves with the hot chemicals. Fortunately, we were only working with very dilute forms of the chemicals, but as safety is of the utmost importance, we ensured that everyone was always wearing safety glasses, people with long hair had it tied back and the area in which we were working was clear. We were particularly careful when we were handling the chemicals, using funnels to pour them into their respective measuring cylinders to avoid contact with them.
Figure 8:
5. RESULTS
5.1 Tables
5.1.1 Preliminary experiments
Table 1 – Volume:
Sodium thiosulfate (23°C, 0.2M) + hydrochloric acid (23°C, 1.0M)
Table 2 – Concentration:
Sodium thiosulfate (23°C, 30ml) + hydrochloric acid (23°C, 30ml)
Table 3 – Temperature:
Sodium thiosulfate (0.2M, 30ml) + hydrochloric acid (1.0M, 30ml)
5.1.2 Final experiment
Table 4 – Temperature:
Sodium thiosulfate (0.2M, 30ml) + hydrochloric acid (1.0M, 30ml)
5.2 Graphs
5.2.1 Preliminary experiments
Graph 1 – Concentration:
Graph 2 – Temperature:
5.2.2 Final experiment
Graph 3 – Temperature:
6. ANALYSIS
The results show that increasing either the concentration or temperature of reagents increases the rate of reaction between sodium thiosulfate and hydrochloric acid. However, the impact of a change in temperature appears to be much greater than the impact of a change in concentration across the range tested. As we can see in graph 1, a 1.2M change in concentration from 0.8M to 2.0M results in a 6.2 second average increase in the rate of the reaction. But if we look at graph 3, we see that a 54°C change in temperature from 4°C to 60°C results in a 47.22 second average increase in the rate of reaction, which is clearly a much greater change. The reason why increasing the temperature has a bigger impact than increasing the concentration is because it provides the particles with more energy, meaning that more of them have the activation energy required to trigger a reaction when they collide. Although increasing the concentration increases the likelihood of the particles to collide, it does not guarantee any more successful collisions as the particles do not carry more energy. We noticed that the range bars for the concentration experiment overlapped, meaning that there was no real difference between the rate of reaction for concentrations despite our negative line of best fit, which was based on the averages of our results.
Graph 3 shows a negative exponential curve of best fit. I am confident with my final temperature experiment results because we took more repeats and were more rigorous in maintaining constant parameters, which is reflected by the low scatter and small number of outliers. I am also confident with my concentration experiment results because although the trend line shows very little change, I feel that this is true of the effect of concentration on the reaction rate between sodium thiosulfate and hydrochloric acid and my vertical range bars are also very small. On my temperature graph I have also included horizontal range bars. These are present because there is a small margin of uncertainty as to the exact temperatures that we were working with as our equipment was fairly crude. It is difficult to keep a solution at a temperature other than 23°C (room temperature) as it will naturally cool down if it is above it by losing heat and heat up if it is below it by gaining heat. The range bars allow for a one degree increase or decrease in the temperature to account for the time it took to measure the volume of the chemicals and transfer them from the water bath to the conical flask. We did not have the same problems with the concentration because once a solution has been concentrated or diluted to the desired level it will remain constant.
7. CONCLUSION
In conclusion, this investigation has shown that both concentration and temperature affect the rate of chemical reaction between sodium thiosulfate and hydrochloric acid and that there is a positive correlation between either the concentration or the temperature and the rate of reaction due to collision theory. This theory also explains why the impact of temperature is much greater than the impact of concentration on the rate of reaction across the range tested. I am generally confident with the results, but I would recommend that further experiments should be taken to investigate the affect of concentration and temperature on the rate of reaction at different ranges as well as the other factors affecting the rate of reaction. These experiments would help me to see how they compare in order for me to develop a more comprehensive understanding of these reaction rates.
8. EVALUATION
In my opinion, the results were reliable enough to establish trends and draw conclusions but not accurate enough to calculate any equations for the reaction rate. This is because Graph 3 shows a low scatter of data around the line of best fit but has high range bars.
Despite the effort that we went through to ensure that we achieved reliable results, there are a number of signs that the experiment did not go as well as we hoped. For example, we have a number of anomalies in our data where the results do not follow the trend. We think that some are down to human error misinterpreting when the tile marked with an ‘X’ disappeared from view while others are due to environmental temperature changes in the classroom affecting our chemicals.. Our range bars are also greater than we had hoped. Graphs 1 and 3 in particular showed an interesting trend, that the range bars grew as the temperature decreased. To improve on this I could get a better method for measuring when the ‘X’ has disappeared other than just by human eye, as on one occasion (table 4, series 1, 4°C), we disagreed about when it was no longer visible. Nevertheless, our averages plot very close to the line of best fit on our graphs, so we can assume that any uncertainty in the results is due to human error.
To improve the accuracy and reliability of our results, I would replace the technique of deciding when the tile marked with an ‘X’ had disappeared by visual evaluation with a laser and a sensor. When the solution becomes opaque, the sensor will no longer detect the laser and will subsequently stop the electronic time. This would reduce the variation in the data. Another suggestion for improvement would be to take more repeat experiments. This improves the accuracy of the average, which is plotted on the graphs. We had already increased the number of repeats to six after completing our preliminary experiments but taking more would improve the accuracy further. If the necessary equipment was supplied to us, it would be possible to achieve results that we could have almost complete confidence in.
9. BIBLIOGRAPHY
Below is a list of sources that I have referred to throughout this investigation. I have detailed the full URLs of these websites and the full titles of any books used in my research.
[1]
[2]
[3]
[4]
[5] Encyclopaedia Britannica
[6] Oxford Dictionary