Water potential is made up of two elements Ψs and Ψp. [The concentration of solutes inside a cell are given by Ψs, solute potential always has a negative number because the attractive forces between solute and water particles reduces the ability of water to move out of the cell. 4] As the cell membrane is stretched it exerts an inward force, the more water that enters the cell the more the membrane is stretched and the more inward force it exerts; this inward force is called pressure potential and is assigned the symbol Ψp. Ψp always has a positive number as the inward force squeezes on substances in the cell moving water out. Ψs + Ψp = Ψ and all of these are measured in kPa (kilopascals).
If one of the earlier mentioned cells (cell A) has a higher water potential (lower negative number) than the other (cell B) then the net movement of water will be from cell B into cell A. This is due to all of the factors mentioned so far. The net movement of water will continue until the two cells are at equal concentrations i.e. enough water has moved from cell B into cell A to dilute the solution in cell A until it is of the same molar concentration of the solution inside cell B. There will now be no net movement of water between the two cells as they have equal water potentials.
Diagram of an example of net movement and pressure and solute potential adding to make water potential in cells.
In the same way if a cell (plant cell in this case) is bathed in a solution one of three things will occur:
- There will be a net movement of water into the cell by osmosis, the vacuole will grow and the cell will become turgid. Osmosis will stop when Ψp = osmotic pressure or Ψ inside the cell = Ψ outside the cell (the concentration of the solution in which the cell is bathed). If this happens then the cell is said to be bathed in a hypotonic solution
- There will be no net movement of water. This can only happen if the Ψ of the cell = Ψ of the solution in which the cell is bathed in the first instance. If this is the case than the solution is said to be isotonic to the solution inside the cell.
- There will be a net movement of water out of the cell by osmosis, the vacuole will shrink and the cell membrane may come away from the cell wall (if it does, then the cell is said to be plasmolysed). Water will continue to move out of the cell until either the solution outside of the cell reaches the same molar concentration as the solution inside the cell, or there is no more water left to move out of the cell. If this scenario takes place then the solution that the cell is bathed in is said to be hypertonic to it.
Diagrams of 1 2 and 3
It is possible to find out which process (1, 2 or 3) has taken place; if process 1 has taken place then the cell will have grown in mass when taken out of the solution compared to its original mass, if process 2 has taken place then there will be no mass change in the potato cell and if process 3 has taken place then the potato cell will have decreased in mass when removed from the solution compared to its mass before it was placed in it.
It is not possible for me to weigh a single cell but it is possible to weigh a sample of a potato which contains millions of cells, it is not necessary to gain a quantative mass change to establish which process has taken place so this does not matter.
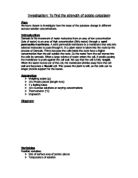
Proposed Method
Since I have now established that if a plant cell is bathed in a solution and there is no net movement of water by osmosis, then the solution the cell is bathed in is isotonic to the solution inside the cell. That this can be proved by weighing a sample of cells before and after they are bathed a solution and finding no change in mass, that if there is a decrease in mass then the solution the cell is bathed in is hypertonic to the solution inside the cells of the potato and that if there is an increase in mass the solution the cell is bathed in is hypotonic to the solution inside the cell. By this I can find the strength of the solution inside a potato cell.
To be specific, If I make different strengths of sucrose solutions and bathe cut sections of a potato in each of these solutions, the weights of the samples before and after being bathed will tell me whether that solution was hypertonic, hypotonic or isotonic to the sucrose solution inside the potato cells. The sample that is isotonic to the solution inside the potato cell has the same water potential as the cell therefore is of the same concentration, therefore it is of the same molar concentration hence by finding this isotonic solution I will have found the concentration of sucrose inside a potato cell.
Based on this I will make solutions of the sucrose concentration 0.0 mol dm-3, 0.1mol dm-3, 0.2mol dm-3, 0.3mol dm-3, 0.4mol dm-3, 0.5mol dm-3, 0.6mol dm-3, 0.7mol dm-3 (dm-3 is a litre so the measurement is moles per litre). I will only go up to 0.7 because I have eaten potatoes before and know that they are not particularly sweet therefore the concentration of the sugar solution inside the potato cells should not be too high (0.7mol dm-3 tastes quite sweet). I will make the solutions by working out the mass of sugar required for each (which does with the amount of distilled water I will use), then weighing it out with a set of scales capable of measuring to one hundredth of a gram, next I will place 20 cm3 each solution into a small vessel with a screw on lids and sticky labels to indicate solution concentration. I will then cut a potato into cubes of 1 cm cubed, as my cutting will no doubt be inaccurate, I will weigh each cube of potato that I will use with the same set of scales. I will then use eight small skewers to hold three cubes of potato each (so that after the experiment I can work out an average of changes for a more accurate result) then put each skewer into a vessel of different sugar solution concentration.
I will leave the samples of potato in the solutions for a weekend to make sure osmosis takes place until equilibriums are achieved between the solution in the cells and the solutions they are bathed in. They will be left in a refrigerator to prevent bacteria flourishing over the course of the investigation.
Before I weight the samples for a second time I will blot them dry as to avoid weighing excess water and I will wipe the scales dry after weighing each sample (to prevent the same thing).
One I have gained my results I will plot a graph that will hopefully explain what happened in the potato samples and examine it by working out the average standard deviation of my results to test the consistency of the results and whether they are reliable or not and carry out a spearman’s rank test to find (if my predictions are correct) a negative correlation between the concentration of sugar solution the potato cells were bathed in and the percentage mass change.
Proposed Equipment
- Weighing scales – To measure masses used to a good degree of accuracy
- Measuring cylinder – Measuring tool for amounts of water used
- Small vessels with screw on lids – Containers for potato samples and solutions
- Sticky labels – I will use as an indicator of contents of vessels
- A potato – Source of potato cells
- Knife – Tool for cutting potato cubes
- Ruler – To measure 1cm potato cubes
- Cutting board – Protection for work surface
-
Sugar solutions (0.0, 0.1, 0.2, 0.3, 0.4, 0.5, 0.6, 0.7 [mol dm-3]
- Paper towel – To blot dry samples before weighing and to dry weighing scales
- Refrigerator – Prevention of bacteria flourishing
This experiment is a fair test as the conditions for each sample are completely identical apart from the variable (the concentration of the sugar solution). All the samples will be left for the same amount of time, at the same temperature, in the same vessels, the same potato is used for all the samples and all of the vessels will be left in the same fridge, hence they will all be at the same temperature (the small differences due to position in the refrigerator will have no effects on osmosis over a two day period.
I will record the weights of the potato samples before and after being bathed in their solutions in a table. I will then draw a graph with range bars and see if I can find a correlation in my results.
Hypothesis
I think that the overall results I obtain will look like this on a graph:
Draw freehand sketch,
1) The reason I have drawn the line curved here is because this is the point that no more water will move into the cell because the Ψp is equal to the osmotic pressure (the amount of force required to stop osmosis). Therefore the cell cannot grow any more in mass (the line can climb no higher on the graph).
2) At this point I believe there will be a direct link between the rise in solution concentration and the amount of mass lost by the potato cells.
3) Here, there will be no more water to move out of the potato cells by osmosis therefore their mass can decrease no less than this point.
Method
A technician kindly made the solutions that I proposed for use. I cut 24 pieces of 1cm3 out of a potato and weighed them to two decimal places, recording their weights, skewered three on every one of my eight small skewers. I labelled each of my eight vessels with sticky labels then poured in the corresponding concentration of sugar solution. I then placed my skewers into vessels and recorded which potato pieces went into which solution so as to know what the initial weight was on removing the samples. I placed the vessels into a tray then into a refrigerator for the weekend.
I removed the potato samples from the vessels. My proposed method did not state that I should use forceps to remove the samples but I had not anticipated difficulty in removing the skewers from the vessels. I then weighed the samples blotting them dry first (not leaving then on the paper towel so the did not lose mass through loss of water by diffusion into the paper towel) and systematically recorded the weights of samples, their change in mass and average percentage change in mass.
Results
(see graphs attatched)
Conclusion
There was a substantial variance in the weights of my samples due to the inaccuracy of cutting by hand (which was unavoidable with facilities in the school lab). This variance, however, is made negligible by calculating percentage changes rather than using mass changes in grams as evidence.
My graph looks similar to the one I predicted though not exactly as the results from 0.0 mol dm-3 give a high point which moves the curve higher than you would predict if you were just shown the rest of the graph.
This could be due to the variance in the amount of sugar in different parts of the potato. (Starch is not soluble in water, therefore it cannot be moved around the potato; because of starches insolubility the potato converts it to sucrose transport). A main reason for the transport of substances required for respiration is when the potato grows a shoot, the new shoot will need a rich energy supply so starch is converted into sucrose, moved through the potato through diffusion, facilitated diffusion etc to the shoot where it is reconverted into starch. However, the potato we used did not have any shoots. This leads me to relate to the point that if cells containing a solution are bathed in pure water, equilibrium of solute potential can never be met. This is because the amount of solute molecules in pure water is fixed (as the solute molecules cannot pass through the selectively permeable membrane) at zero whilst the amount of solute molecules in a solution is always more than zero i.e. no matter how much water moves into the solution (in the cells) it cannot dilute it to 0.0 mol dm-3.
Apart from this large difference between values 0.0 mol dm-3 and 0.1 mol dm-3 my graph turned out the way I expected. I anticipated the curves at both ends of the graphs at the stages where (in the positive region) water was not entering the cell at a steady rate because pressure potential from the membranes and cell walls were preventing it more and more and (in the negative region) where there was little more water left to move out of the cells by osmosis.
My graph shows that I did not use a solution that was exactly isotonic to the solution inside potato cells by the fact that it does not cross the x axis at a point where y is an integer. However I can predict a concentration which is isotonic to the solution inside potato cells by reading the point that my hand sketched curve crosses the x axis.
The range bars on my graph give a visual indication of the deviation of the results from the average found. This gives an indication of how constant the results I obtained were. To find out exactly how constant my results were I calculated the standard deviation of the results of each concentration then found the average of that number, hence finding the overall average deviation from the average percentage changes in mass found in my table of results.
Standard deviation = √∑x2 - ∑x2
n n
Which is the square route of zigma x squared over n minus the mean squared
The average standard deviation of my results is 2.48%, which is quite accurate (if you can imagine two lines on my graph above and below the line for average results plotted). The reason for different results from samples in the same concentration could be due to the fact that each sample will have lost a different amount of water before weighing on extraction from the solution.
Not only did I calculate the average standard deviation of my results but I also carried out a statistical test on my results; the most relevant test to my data is the spearman’s rank test which finds out and proves whether there was any correlation between the concentration of the sugar solution the potato samples where bathed in and the percentage change in mass of those samples.
Firstly I plotted a graph, plotted each value individually and drew a line of best fit, as sugar concentration increased, percentage change in mass decreased. This led me to believe that there was a negative correlation between the two factors. However sight is not enough to tell whether there is actually a negative correlation between the two and that they have not just fallen into those places due to luck; so I conducted the spearman’s rank test. To carry out the test I must drew a table containing the variable (molar concentration of sugar solution) and its corresponding value (percentage change in mass). Then I assigned the highest value of each the rank 1, second highest the rank 2 and so on. Once I had ranked the data I worked out d, the difference between the two ranks and then ∑d2 so as to use the formula
Rs =1 – [6 X ∑d2]
[n(n2 – 1)]
Which would give me a figure I could use to find whether there was definitely a relationship between the factors (concentration of sugar solution the potato cells were bathed in and the percentage mass change) by looking at a spearman’s rank table I found that if this figure was a negative number and above 0.738 there would be a negative relationship between the two factors.
The figure I gained from the equation was –1, which shows an extremely strong negative correlation between the concentration of sugar solution the samples were bathed in and there percentage change in mass as I expected.
According to my graph the concentration of the solution inside potato cells is 0.23 mol dm-3
Evaluation
From my results I can see that there is a very definite negative correlation between the concentration of sugar solution the potato samples were bathed in and the percentage change in mass of the potato samples. By finding the average of percentage change in mass of the potato samples at each concentration and plotting on a graph joined up with a smooth curve proves, however, that there is not a linear relationship. This is what I predicted from my theoretical knowledge stated in the hypothesis and this experiment supports those ideas.
The equipment I used to measure quantities in this experiment (ruler, measuring cylinder, weighing scales etc) were all of an accuracy which allowed enough impreciseness to alter results, each had to be used with patience and care in order to achieve the highest accuracy using it. With the equipment that was at hand during this experiment I did not expect to gain a set of results that were perfect because of the inaccuracy of the equipment, but to gain a set of results that were strong enough to support the theory stated which has been done.
By working out the standard deviation (2.8%) of my results I found how constant my results were which gives an indication of reliability (the lower the deviation the more reliable the results) and as 2.8% is a relatively small percentage I can safely say that my results are reliable enough to use as evidence to support the theory and therefore the hypothesis of this investigation.
I could improve this experiment by using more accurate measuring equipment; this would give a set of results, which produce a curve, and correlation graph that would be more “true” than the ones attached. Another way to improve this experiment could be to measure the amount of water left inside the vessels and measure it exactly, this way it would be possible to account for losses due to blotting the potato dry. If the potato samples were cut into smaller pieces or diced then the experiment could have been performed in a smaller amount of time.
As the aim of the investigation was to find the concentration of sugar solution inside potato cells, therefore it would be a good idea to carry out another experiment with exactly the same method except using finer concentrations e.g. from 0.22 mol dm-3 to 0.24 mol dm-3 using a range of solution increasing by 0.01 mol dm-3, and more accurate measuring equipment e.g. weighing scales to the 1000th of a gram and obtaining a more accurate value of the concentration of sugar solution inside potato cells.
As an extension, by finding the osmotic pressure of water when separated from the sugar solution that is isotonic to that inside potato cells you would find the Ψp of the potato cells when bathed in pure water.
Appendix
¹ Understanding Biology For Advanced Level
² Letts A Level Biology
³ Chemistry in context
4 Collins AS Biology