Pure water has the highest water potential value of zero. After finding this I can predict that all the other cells will have a negative water potential value (less than zero). Cells with higher water potential will have a less negative value than those with lower water potential. A negative number, for example -4 has a higher caliber compared to a more negative number such as -14.
Preliminary Work
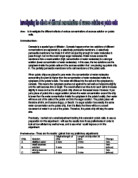
Before carrying out this investigation, I carried out a similar experiment. This experiment consisted of comparing the water potential of carrot cell by taking into account the changes in mass. However instead of using sucrose solution sodium chloride solution was used. This experiment was carried out in a few simple procedures:
1) 6 cylinders of carrot were cut and weighed.
2) 6 different concentrations of sodium chloride solution were prepared
3) The carrots were placed in the different concentrations which ranged from 0-100%
4) The carrots were left in the solutions for 45 minutes
5) After which the carrots were removed, and the masses weighed and recorded. With this information the % change was worked out.
Results
From doing my preliminary work I found that the higher the concentration of sodium chloride, the larger the percentage decrease in mass. As the solutions become weaker less mass is lost by water leaving the cell. The largest %percentage increase in mass was 16.6%. This was seen in the solution that contained 100% distilled water. I think that osmosis is the reason behind this as, the carrot in the solution with the highest amount of distilled water (0.0 mole/litre of sodium chloride solution) gained the most mass. This is because the water molecules diffused from a region of high water concentration (in the solution), to a region of low water concentration (inside the carrot). This shows that osmosis did take place throughout the experiment, it also shows that the osmosis theory is correct and works.
Carrying out this preliminary experiment helped me to plan my investigation in numerous ways. For example, I was unable to repeat my preliminary experiment but I have decided to repeat the experiment in my investigation. I feel that only one set of results would not be reliable and accurate. By repeating my experiment I will be able to notice whether I am carrying it out properly or whether I get any anomalies. It could also confirm that the results I get first time round are accurate. My preliminary experiment gave me an opportunity to test the method that I would use in my investigation and find out the strengths and weaknesses of the experiment so I could improve my investigation accordingly.
Variables and fair testing
Whilst carrying out this experiment I know there will be a number of variables which I will need to take into account and in order to make my experiment as fair as possible I will need to structure my experiment accordingly. It is important to have a fair experiment and this ensure that I will get the best possible results and that will help me come to a reliable conclusion.
These variables include:
- Using the same potato and Swede.
I need to make sure that I only take samples from the same potato and swede. This is because different vegetables have different tissues and so can change the results of this experiment dramatically. And so is would not be fair to use different samples. To make sure this does not occur I will use the same vegetable and try to take samples from a certain area of the vegetable so that the tissue sample that I use will be almost the same
Using the same sized samples of potato
I will need to use the same sized potato and Swede samples whilst carrying out the experiment. In order to ensure the surface area of all the samples is as similar as possible. This is because if I took different sizes of vegetable samples, I would be experimenting with miscellaneous sized external and internal areas. I will make sure that I use the same sized samples by cutting the potato and swede samples a fixed size each time.
-
Leaving both potato and swede in the solution for the same amount of time
I need to leave both the potato and swede in the sucrose solution for exactly the same amount of time. This is because if either one of the vegetables were in the solution any longer then the other that would mean that that sample would have a longer time to go through the osmosis process. This could lead to anomalous results in the experiment. Therefore I will control this variable by putting both a potato and swede samples in the same test tube of different sucrose solutions. And so I will be able to keep a fixed time for my samples to be in sucrose solution.
Using the same strength of sucrose solution
I need to use the same strength of sucrose solution whilst I am making different concentrations for my vegetable samples. This is because, even though I will be using different concentrations I need to use the same sucrose solution to start with. This will ensure that my results are as reliable as they can be.
- Ensuring the temperature is constant throughout the experiment
A change in temperature can effect the results of this experiment. As a rise in temperature would increase the collisions between the molecules. This is because the molecules in the solution would obtain more kinetic energy enabling them to move faster and therefore more successful collisions would occur. And so I will need to keep the temperatures of the sucrose solution and vegetable at a constant.
- Using the same pipette to measure the solutions
Making sure that the same pipette is used throughout the experiment is important, as contamination would not be a problem. This would affect the results of the experiment as the concentration of the solutions may change if contamination occurs. I will also need to make sure that I read from the bottom of the meniscus every time I use the pipette to get accurate results each time.
- Using the same weighing equipment each time
It is important to use the same weighing equipment each time as a change in weighing equipment could lead to inaccurate measurements. This is because one weighing scale could be taking measurements to 0.2g whereas another balance could be taking measurements to 0.1g. Although this may not seem like a major difference it could effect the final result.
- The overall amount of each solution
I need to keep the overall amount of each solution the same the more solution the test tube contains; the more particles there are in that particular volume. Therefore I will be keeping the solution 10cm3 in order to avoid any anomalous results caused by having different amounts of solution.
Although I will be controlling many variables in this experiment there is one variable, which I need to vary in order to complete, this experiment. This variable is:
- Using different concentrations of solutions.
I will not be controlling this variable so each of my test tubes will contain a different concentration of sucrose solution in them. The concentrations will range from 0-100% concentrations of sucrose solution as shown in Figure 1. In order to compare the water potentials of potato and swede I need to compare the water potentials of each vegetable in different solutions. I will do this by taking into account the change in percentage mass when the vegetables are placed in different concentrations of hypertonic and hypotonic solutions and osmosis is allowed to take place.
Fig.1 A table to show the concentrations of sucrose solution I will be using.
Equipment
- 12 test tubes
- Water
- Test tube rack
- 1 molar sucrose solution
- 10ml graduated pipettes- in order to get a more accurate measurement of the concentrations
- A potato
- Electronic weighing balance- for a more accurate measurement of masses.
- A Swede
- Scalpel- to cut the samples into the same sizes
- Cork borer
- White tile- to see the samples clearer in order to cut them accurately.
- Paper towels
Method
-
Using a cork borer cut pieces of the potato and swede on a white tile into cylinders. In order to ensure that all the cylinders are the same size, use a ruler and scalpel to cut them all exactly the same size.
- Blot the vegetables on a paper towel to relieve the vegetable of excess water before weighing the potato and swede and recording the masses of the vegetables.
- After weighing the vegetables on an electrical weighing balance which is set to weigh to the nearest 0.01g. Label six test tubes 1.0, 0.8, 0.6, 0.4, 0.2, and 0.0.
-
Make the different sucrose solutions in corresponding test tubes. Use the table in Fig.1, which shows the amounts of sucrose solution and distilled water each test tube will hold.
- As soon as this is completed, place a potato and swede cylinder into each test tube. Therefore there will be one potato and one swede cylinder in each test tube. Leave the solutions and vegetables in the test tubes for 30 minutes.
- Once the 30 minutes are over, re-blot the samples and weigh them again making sure the same electrical balance is used.
- With the original and final masses recorded the percentage mass can be calculated.
Diagram
Safety
Although it may not seem like it this experiment can be quite hazardous if the following safety precautions are not followed.
Firstly, all basic safety rules must be followed whilst in the lab such of which include; making sure that all stools and bags are tucked away under the desk so they do not cause an obstruction to anyone. Although it is obvious it must be pointed out that there should not be any running or shouting in the lab especially whilst the experiment is being carried out. Also all loose clothing and long hair should be secured. Although no food and drink is not allowed in the lab one must take extra care not to break the rules whilst conducting an experiment. In this experiment one should be extremely careful whilst using the cork borer and scalpel as they a both very sharp. Goggles and an apron should be worn as necessary.
Results
Figure 2
Fig 2 shows a table showing the results from conducting the experiment with potato
Figure 3
Fig. 3 shows a table showing the results from conducting the experiment with swede
Calculations
The averages were worked out by the following equations:
Average = (Original Mass + Repeat)
2
= (Final Mass + Repeat)
2
The percentage change in mass were calculated by using the equation below:
% Change in Mass = (Average Final Mass – Average Original Mass) x 100
Average Original Mass
Analysis
In order to present the results of my experiment clearly I have placed them in a table.
Then from this table I was able to plot a graph, this enabled me to spot any trends easily as the results are visual and therefore easy to see.
From this graph it is easy to see that the results from this experiment are quite similar for both potato and swede. From this it can be said that as the solute potential increased the mass in both vegetables decreased. This is proven by seeing that both the graphs have a negative correlation. The line of best fit drawn onto the graph easily shows this. Although the gradients of both potato and swede seem considerably similar, it is apparent that the swede samples gained more mass than the potato samples in a low concentration of sucrose solution. However, in the concentrated sucrose solution, the potato samples have lost more mass then the swede.
Conclusion
I believe that the reason behind the results I got is the osmosis theory. Osmosis is the net movement of water molecules from a region of higher water potential to a region of lower water potential, through a partially permeable membrane.
I found from my results that my prediction was true, I predicted that the swede should gain more mass than the potato samples when placed in a hypotonic solution. The swede samples had a relatively higher mass then potato in the lower concentration solution. As it has the most water particles (0.0 concentration of sucrose solution). The main reason behind this that swede had more sugar (2g) in it than water molecules when compared to potato (1g). Because of this, when swede is placed in a solution of higher water concentration than itself (swede), osmosis takes place. This means that the water molecules in the higher concentration, in this case the sucrose solution, diffuse to the region of higher water concentration, the swede cells. This caused an increase in mass in the swede cells. The gain in mass in the swede samples was higher than that of the potato samples because, water only contains 1g of sugar in it leaving more space for water molecules compared to the swede cells. This means that when osmosis is taken place with the potato and sucrose solution, less water molecules are gained. This is because less water molecules will ‘fit’ in the potato cells before it would burst compared to the swede cells. This means that potato can only gain certain, limited number of more molecules before it would burst. This shows that the pressure potential is a limiting factor.
I also found that my second prediction proved to be true. My prediction was that, both swede and potato would lose mass in a high concentration of sucrose solution. In this case potato lost more mass than swede, because the potato contains a higher amount of water molecules than swede.
Evaluation
Looking at my graph it can be seen that I only have one slightly anomalous result. It is located on the potato results at the point of the concentration 0.4 moles/litre. Reasons for this could be lack of accuracy, or carrying out techniques inefficiently. For example; the sucrose, due to human error, may not have been read from the bottom of the meniscus. The potatoes may not have been blotted exactly the same as it is highly unlikely that the same amount of pressure was used each time. This sample of potato may not have been exactly the same size giving it a larger surface area. Other limitations I had were the fact that I could only repeat my experiment once due to lack of equipment and time. Repeating it more times or more then once would have most definitely increased the reliability of my results. This limitation of equipment and time only allowed me to have 6 samples. A large number of samples would have given me data over a larger spread and therefore in more clearer interpretation. Equipment of better quality and latest technology would have enabled me to produce more dependable results. The variables I kept constant did experiment justice and allowed it be as accurate and dependable as possible. However there are obviously the above exceptions.
Improvements I could make to my experiment are to first and foremost ensure that the above limitation are invalid. I could be more accurate, and carry out more repeats. Overall, I understand that, to reach a reliable conclusion my experiment on its own is not enough. Ideally another experiment should be carried out to sustain my conclusion. Different variables or isotonic points could be considered.
Bibliography
The sources I have used to research are:
- Cambridge, Advanced sciences, Biology 1 endorsed by OCR
- Advanced Biology for you, Gareth Williams
-