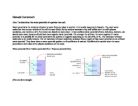
The results show a general trend which can help me make my prediction. As we see as the sucrose concentration increases the chance in mass decreases. Example, at 0.20 M the change in mass is 9.37% whereas at 0.80M the change in mass is at -22.58% so this will help me make a prediction about the general trend.
The graph
The concentration at which there is no change in mass (plasmolysis) was at 0.48M. Therefore the water potential for the potato used in my preliminary was around -1416kPa. But as there are many things which could be improved to make the results more accurate and reliable therefore there will be many changes to the method.
Improvements to the Main Method
- The most significant change I will do is that I will repeat the experiment 3 times till I get concordant results for me to get a reliable average.
- I will try and cut the potato tubas to the same size so that they will have the same mass and surface area to get the most reliable results.
- I will do a wired range of sucrose concentration so that I will get a more reliable line of best fit and therefore get more reliable water potential for the potato.
- I will make use I will wash all glass wear with distilled water at first and then with the solution with in will contain.
- I will keep all the potato tubas in the test tube for the same time over the same period.
- I will weigh the potatoes after weighing the filter paper and taking the mass of the filter paper was once weighed again. This will reduce any error in the mass.
- I will measure the concentration using a pipette with a smaller error to get my results as accurate as possible.
Prediction
So concerning this I can predict that if the water potential is greater outside the potato cell, then there would be swelling of the cell, as the water molecules enter the cell down a water potential gradient via osmosis. The cells become turgid, with the protoplast pushed up against the cell wall, it should gain in length and mass.
And if the potato cells are placed into a solution where the water potential greater inside the cell then outside, then there would be net moment of water towards the outside of the cell. Resulting in the protoplast shrinks and the plasma membrane pulls away from the cell wall. The cell wall is freely permeable and the plasma membrane is partially permeable.
Osmosis occurs until equilibrium is reached. So if the water potential on each side of the cell membrane is the same, there is no net moment of water across the membrane, therefore the water potential of the potato tissue can be determined by balancing it with an external solution which produces no mass or volume change in the potato tissue.
Therefore when the potato is placed in a solution with higher water potential, closer to zero, than the potato cells the potato will gain mass. They will lose mass when placed in one with lower water potential, as in both cases water molecules move down a water potential gradient because there are not at equilibrium.
So when I plot a graph of the gain and loss of mass in the potato tuba (g) against the water potential of sucrose solution at the point at which the line of best fit intercepts the X-axis, water potential of sucrose solution. This is the point where there is no change in mass of the potato tuba and then using the concentration at which there is so change in mass I will figure out the solute potential and as the pressure potential is 0, using the formula I know the water potential would be the same as the solute potential.
As I did a preliminary I can predict that the water potential of the potato tuba would be around -1350kPa depending of the age of the potato and its starch content with can be broken down making glucose which is soluble; lowering the water potential of the potato.
Apparatus list
Main Method
- I will collect all my equipment and correct quantities of solutions.
-
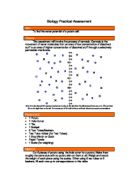
I will use the potato chipper to cut 6 × 3 chips of potatoes, I will then cut them all to exactly 20mm long on my white tile using the scalpel knife.
- I will blot each potato chip with tissue paper.
- I will then weigh each potato chip on the electronic scales to 2 decimal places and record it on the table of results. Handle with tweezers.
-
I will then make up 3 × 10cm3 solutions in the six different concentrations of sucrose in the boiling tubes using the 10cm3 pipette and label them using labelling stickers and while measuring read along the meniscus and in eye level to avoid parallax error.
- I will then add in a potato chip to each different concentration at staggered one-minute intervals, noting the order in which the potato chips are added. This means that when, when I come to take them out of the solution, there is enough time to measure and record the mass of each potato chip before the next chip has to be removed. This in turn means the time each chip is immersed in the solution is kept constant, increasing the accuracy and reliability of the results.
- Then I will repeat the steps 2-6 two more times, recording the start times to keep it as fair as possible.
- This will then be left over two days until the next lesson in a place where they won’t be interfered with.
- When the time comes to take the potato chips out; remove the chips at the staggered intervals they were added to the solution. Blot them, dry using paper towels, blotting each chip once only, ensuring that the amount of solution removed from the surface of the chips is constant. Reweigh the chips on the same digital balance as used before. Record the results to two decimal places, as before, in a table and work out the averages. This ensures uniform precision throughout the experiment, increasing the reliability of the results.
- I can then draw up a graph of my results and find the water potential of the potato chip.
Explanations
2. The potato chips all need to be exactly the same size, so cutting them all with a potato chipper would ensure them all of the same width and by measuring them with a ruler would ensure equal length. These measures would have to be carried out as they all must be the same surface areas to ensure fair testing. The surface areas must be kept the same, this is because if there were to be a difference in surface area, there would not be a constant area of potato directly exposed to the sucrose solution. Thus resulting in a different amount of water molecules being able to either exit or enter the potato (membrane) at one time To get the same surface area a potato chipper will be used and the potato sample will be cut to 20mm in length.
3. The reason for blotting the potato chips is to remove excess water from the outside of the potato sample that may effect the mass when weighing.
4. The mass of the potato chips must be recorded before being soaked in sucrose solution, as well as after because the change in water loss or gain from the potato chip is important as it helps to determine the water potential. As it is the difference in this loss or gain that I will be recording on the graph. The masses may slightly vary because of human error when trying to cut the potatoes. The exact starting mass isn’t important to be consistent throughout the experiment, as it is only the difference in loss or gain in water that is. Although a similar mass is required because if there were major differences in mass there maybe a difference in the amount of water in that sample of potato and they may have very different water potentials to the other samples of potato. Handle the potato with tweezers, as grease from hands is non-polar and therefore makes the surface of the potato less permeable to water, which is polar.
My results will be plotted on this table
Risk assessment:
Safety:
In general this is a fairly low risk investigation. Sucrose is purely a sugar solution, therefore it is not an irritant or explosive. Hence the only reason to wear safety goggles is to avoid the annoyance of squirting solution in your eyes. It is not essential. A lab coat would be advisable to protect ones clothing from spillage. A lot of equipment is made from glass; therefore care must be taken to prevent these from slipping and smashing.
Analysis
As we can see from the results and the graph my prediction for the change is mass was correct. From the graph we can as the concentration increases the change in mass decreases and the concentration decreases the change in mass increases. From the graph we can see that at a low concentration e.g. at 0.2M the average change in mass was +6.27% as the water potential is greater outside because there are more water molecules outside the potato cell, so there was swelling of the cell, as the water molecules enter the cell down a water potential gradient via osmosis and as we know osmosis is the moment of water form a high water potential to a low water potential. So the cells became turgid, with the protoplast pushed up against the cell wall, it gained mass and length.
But as the concentration of increases e.g. 0.6M the average change in mass was -33.42% as the water potential was greater inside the cell because there are more water molecules inside then outside, so via osmosis there was be net moment of water towards the outside of the cell as osmosis is from a high water potential to a low water potential. Resulting in the protoplast shrinks and the plasma membrane pulls away from the cell wall.
From this we notice that when the potato is placed in a solution with higher water potential, closer to zero, than the potato cells the potato will gain mass as water moves in by osmosis. They will lose mass when placed in one with lower water potential, as in both cases water molecules move down a water potential gradient because there are not at equilibrium.
When they are at equilibrium it must mean that the water potential on each side of the cell membrane is the same and there is no net moment of water across the membrane, therefore the water potential of the potato tissue can be determined by balancing it with an external solution which produces no mass or volume change in the potato tissue. And in our case it was sucrose solution.
We can find out at what concentration there is no change in mass and the potato cells are plasmolysis using the equation of the line of best fit. There is no change in mass when y=0. So the concentration at which there was no change in mass was 0.21M. So using the other graph about the solute potential against the morality I estimated that the water potential of the potato was -568kPa. As there is no change in mass and the cell is at plasmolysis and there is no osmosis talking place and there is equal water potential on both sides the pressure potential must be 0, so the solute potential must be -568kPa then the same must be the water potential.
Water potential (Ψw) = Solute potential (Ψs) + Pressure potential (Ψp)
Water potential (Ψw) = -568kPa + 0
Water potential (Ψw) = -568kPa