I have identified a possible factor which may affect the outcome of my investigation which is Temperature. An increase in temperature acts as a catalyst which speeds up reactions, although osmosis isn’t a reaction I have had to think about the effect of which it could have, and I have concluded from speaking with colleagues and professionals that it would affect osmosis. We know that osmosis is caused by molecule movements so, when temperature goes higher, molecules move faster. So, Osmosis will increase.
If we decrease temperature, the rate of Osmosis will decrease too. I have taken control of this by ensuring that all the beakers remain the same temperature, so by leaving them at room temperature in the same room this should eliminate temperature from affecting my results.
Modifications to initial plan from preliminary test
I decided to increase the amount of solution to guarantee a sustained period of osmosis, and the starting mass of the potato chip to increase it from 0.6g to 0.9g to enable more clear results and larger numbers to deal with and also to leave the test for longer (approx 24 hours) to ensure that osmosis has taken place and given more of a chance to act and for us to notice results. From the preliminary test some equipment I have decided to change where appropriate for valid reasons. I have decided to use the smaller measuring cylinder to measure the solution more accurately.
I have chosen to use beakers not conical flasks as getting the potato chips out of the flash without causing breakages at the end would be nigh on impossible and then to accurately get results like length could easily be affected. I chose to use 40ml of solution as it covers the potato chips fully and is a reasonable amount without extra unnecessary solution.
I thought it would be a good idea on how to better evaluate my test like showing a step by step plan on my procedure and provide justification of doing so.
Label 5 Beakers with solution names and my initials (for easy recognition).
Measure and add 40ml of the correct solution into each beaker.
Then measure and weigh potato chips, weight must be within 0.05g of 0.9g
Take note of solution chips added to, and then leave for approx 24 hours.
Real Test
The next stage of the investigation was to complete the actual test, using the above plan and modifications here are the results below. I needed to ensure this was going to stay a fair test so I needed to accurately measure the solution and potato chips each time, as if not done properly or written down incorrectly it could affect my results. I also needed to place the chips in at the same time. There was only one variable which was the solution and everything else had to stay the same, with one exception of the potato chips with a 0.05g leeway.
By looking at the results I can see a very clear trend. With that the higher the concentration the lower the change in mass and there is also a similar pattern in length with the most growth in the less concentrated solutions.
I have identified an anomaly from my data, I concluded this wouldn’t be fair to base a graph on it, or use it in my results so I repeated the test for the 10% solution.
I felt I needed to get another set of results so I could write a comparison of sort, so because we didn’t have enough time in class to repeat the experiment, I borrowed a reliable set of results from a friend.
In comparison the results differ but both show similar trends for Mass and Length. The changes are different, but this is most probably due to the different constants that they used which was 20ml of solution not 40ml.
I have produced an appropriate scatter graph which shows a correlation between the concentrations of solution with the change in mass. I only chose to show the change in mass, as I felt that this showed the most significant change to base my conclusion on. The graph shows a definitive strong correlation between mass and concentration of solution.
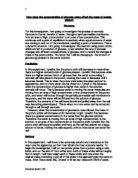
I observed the potato chips and noticed that the skin of the potato stretched which provided again more evidence of the potatoes expansion.
Conclusion
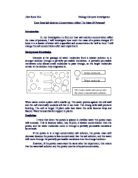
In Conclusion I believe that Osmosis has happened within the cell (potato chip) due to valuable evidence by 2 sets of data. Although I cannot work out averages for this particular experiment as we didn’t have time to repeat there can be some limitations. But we can guess that the potato chip has a higher concentration of glucose in its cell, as it expanded and gained molecules, where it obviously didn’t lose any because all chips gained mass. So we can see that 10% is probably a similar percentage of concentration of that in the potato cell.
Evaluation
I believe there could be alternative ways to collect the data I collected by maybe looking at a smaller mass of potato chip and only giving it a few hours for osmosis to happen.
There have been limitations to my conclusion due to the fact I didn’t have time to repeat the experiment. Possibly I could have placed two potato chips in each solution to save time, and maybe dye the second one a different colour possible using red cabbage juice or food colouring.
The evidence was gathered fairly, with the chips being in the solution the same amount of time, time same amount of solution, and accurate readings, weighing & use of sophisticated equipment including eyesight, so I would believe the data is pretty reliable. We did have one anomaly but the test was repeated and a new result taken.
To help make the data more secure we should have taken measurement of maybe the density of the potato chips or volume of it to help picture the change in mass. But the all results were precisely measured so the data should be reliable & secure.
Permission to use their data was kindly granted by Laura Barker.