Variables that will affect this experiment are the surface area of the potato as if it is bigger then the rate of osmosis will increase so to make it fair I will use potato cores of the same size. Temperature should also affect the rate as there will be more energy so I will do all my tests at the same temperature. If the time allowed for the experiment is greater then osmosis will happen more so all my tests will happen over the same time period. To try and keep the concentration similar I will use a bung to prevent any spillages and evaporation.
I have performed two preliminary experiments at 1% and 0% concentration. I did these over 45 minutes and I found that 1% was higher than the concentration in the potato and 0% was lower. This was shown as I predicted, the potato got bigger in a lower concentration and smaller in a higher concentration. So my experiment will work with the concentrations I plan to use. The experiments also showed that 45 minutes didn’t show a very big change in size and after leaving them over 3 days I found that there was a much larger change in size but leaving an experiment for 3 days is a bit long so I will do it over 2 days. I predict that the concentration of potato will be approximately 0.3% as my preliminary experiments show there was a bigger change in concentrated sugar solution then water. I also predict that this experiment will produce a straight line as osmosis will continuously happen.
Obtaining Evidence
Immediately I noticed that in high concentrations the cores floated because the solution was thicker but this is unlikely to of affected our results. When taking my results I found that the cores in the high concentration of sugar had made a very sticky and thick solution. This was probably because starch form the potato had got into the solution. The thick solution caused a problem as when weighing the potatoes at the end needed to be drained and draining to different standards may have caused some unfair results so I tried to get as much of the solution as I could off. I also noticed that the potato cores in the low concentration had become very hard whereas cores from high concentrations were floppy.
Analysis
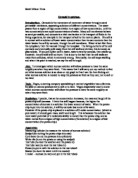
My results show that as the concentration of sugar solution is increased the potato core gets smaller as I predicted. The table suggests that the concentration of sugar is likely to lie between 0.2% and 0.4%. The core goes hard in water because water that has been transferred through osmosis goes into the vacuole and pushes the cell membrane tight against the cell wall. Plants use this to make them stand up. This diagram shows the difference between a turgid and a flaccid cell:
By drawing a line of best fit my graph also shows that as the concentration of sugar solution is increased the change in mass decreases. However it also shows that the graph seems to level out at low concentrations. This is likely because when the cell membrane is tight against the cell wall the cell can’t take in any more water. It also levels out at high concentrations probably because either the concentrations have been levelled or most likely the cells cannot lose any more water. The graph crosses the x-axis at 0.275% suggesting that this is approximately the concentration of sugar in potato. This is probably lower than I predicted because the graph curves unlike what I predicted.
Evaluation
This investigation was useful as it has shown not only that potatoes have approximately 0.275% sugar in them. It also shows how osmosis happens and why. I have also shown how cells become flaccid and turgid and how this helps plants to stand up.
My results have been accurate and this is shown by how close the points on the graph are. However there is one odd result which I have circled on my graph. This could have occurred because the concentration was accidentally measured incorrectly or I might have inaccurately measured the mass of the potato.
I could improve my method by using more accurate measuring instruments. If I had more time I would of also repeated more tests and used a wider range of concentrations. After reviewing my results I could go back and look more in depth at concentrations close to my approximate concentration to get a more accurate result. I could also change the time I leave the experiment for as if I leave it for longer there is more likely to be a clearer result.
Error in my investigation could have been caused by many variables and reducing the amount of errors will produce clearer and precise results. One error is that it is hard to find the mass of a potato if it has a layer of thick solution around it which could be got rid of by drying the outside of the potato with a paper towel. Another error is the inaccuracy of measuring devices which can be solved through more accurate measuring devices. Osmosis is also not very accurate as it does not select the concentration it levels. So water will be distilled into the potato to level the concentration of sugar as well as other concentrations such as starch. This will not affect the shape of the graph but it will mean the concentration of sugar in potato is less than what I have found.