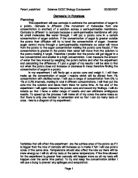
Before I write my plan I am going to carry out some preliminary experiment to help me construct it. The first prelim I will conduct is one to find the optimum length of time that the potato is in the sucrose solution. In this experiment I will vary the length of time and control the sucrose solution to 0.4 molars and the size of potato to 6mm diameter core which is 4cm long.
These are the results:
As you can see from the results the optimum time that I found was 6 minutes there fore in my final investigation I will leave the potato in the sucrose solution for 6 minutes. Here is a graph to visualise my results:
The next preliminary investigation I will carry out is to discover the optimum size of potato chip. I will therefore vary the length of the core but keep its diameter to 6mm. I will control the sucrose solution 0.4 molars and the time to 6 minutes.
Here are my results:
As you can see the length that gave me my best result is 3cm. Therefore I will be using that length in my investigation.
My Method:
- Cut 15 pieces of 3cm long potato cores with a 6 mm diameter. I have chosen 15 so that I can repeat each concentration of solute 3 times. This is for increased accuracy.
- Divide the pieces of potato into 3 groups of five. Label the first group in individual dishes and weigh them, recording the weights.
- Measure 5 measures of different strength solutions using a measuring cylinder. I will use:
-
0.2 Sucrose →0.8 Water
-
0.4 Sucrose →0.6 Water
-
0.6 Sucrose →0.4 Water
-
0.8 Sucrose →0.2 Water
The measurement should be 25 ml as that is enough to cover the potato.
- Pour solutions over the pieces of potato, and set the timer.
- Place lids on the dishes to decrease the chance of evaporation as this is a factor that can partially be controlled by this.
- After 6 minutes take the potatoes out of the solute and pat dry to remove excess solution.
- Weigh the potato pieces again and record the results.
- Repeat this process with the other two groups of potato pieces, additionally record those results.
There are some key factors that I must think about: Initially I may use different apparatus from one lesson to another. To avoid this occurring I will label the apparatus I use and use the same set the next lesson. An extra factor that could affect my experiment is the temperature outside. If one experiment is carried out one day and the other the next day the starting temperature may be different, this may affect the data. This is harder to control, and unless I complete the experiment in a hotter environment i.e. the oven I cannot control it. This is most defiantly a flaw in my investigation.
For accuracy I have used lids on my dishes to try and reduce evaporation, I have used a percentage increase in my results rather than the weight difference. I have done this because it gives a fairer result because the starting weights are all slightly different. Another accuracy measure I have taken is patting the potato pieces dry after their time in the solution, it removes excess solute so that when weighing we are weighing the solution that has past the partially permeable membrane.
I would have liked to use a pipette filer for more precision however they were being used by another class and were not available to me.
My hypothesis
The solution should affect the rate as a stronger solution would contain less water particles therefore I predict that the higher the solution the smaller the amount of osmosis is taking place. To explain this theory further a high concentration of sucrose solution would have more sugar particles in it than water particles, therefore when a piece of potato is placed in it, it has a higher content of water particles in it that the solution that surrounds it, osmosis cannot take place. This is because osmosis is the transfusion of water through a partially permeable membrane from a high concentration to a low concentration.
Here is a graph I have drawn from my predictions:
The black line is the trend line. I.e. line of best fit.
Apparatus used:
- Potato corer (6mm diameter)
- Conical flasks
- Petri dishes and lids
- Small scale scales
- Knife
- Stopwatch
- Measuring cylinder
- Paper towels
Materials used:
- Potatoes
- Sucrose solutions
Image of Apparatus:
My Results:
The white cell is an anomaly. After I noticed it I repeated that experiment again and had the result 1.026% which I feel is more credible.
The trend line matches my prediction. As I predicted the solution should affect the percentage change as a stronger solution would contain less water particles therefore the higher the solution the smaller the amount of osmosis is taking place. To clarify this theory, a high concentration of sucrose solution would have more sugar particles in it than water particles, therefore when a piece of potato is placed in it, it has a higher content of water particles in it that the solution that surrounds it, osmosis cannot take place. This is because osmosis is the transfusion of water through a partially permeable membrane from a high concentration to a low concentration.
The peak of the graph shows the solution where the most osmosis occurs, after that point the amount of water particles compared with the water particles in the potato starts to balance out, causing less osmosis to occur. At the end of the graph near the 0.8m points there are more water particles than sucrose particles, in fact there are 4:1 water particles to sucrose particles. This causes the water particles to use osmosis to leave the potato and enter the solution; this is why the potato looses weight.
When comparing my predicted graph to my actual graph I found that they were very similar, therefore my theory has to be correct. The peaks and troughs are in the same places, and the starting points and finishing points are in similar places. I feel that my results are very reliable as the two graphs are so similar.
Evaluation:
Overall my results seem very consistent. However one anomaly did occur, I therefore removed it and re investigated it. My graphs were very similar and proved my theory fully.
If I was to repeat this investigation I would use more controlled conditions. Therefore I would control the variable of temperature better; I would also use perpette filler for better control of the amount of solution.
I think that this investigation went well as I carried it out to the best of my ability in the conditions provided. My range of 4 concentrations were sufficient enough to plot a graph of my results which supports my prediction, giving enough evidence to support a firm conclusion. However I think by extending my range of concentrations (e.g. 0.1m, 0.3m, 0.5m etc.) I would have gained much more accurate and reliable results then those which I have now. The procedure and method which I followed were standard and easiest to perform. By following these procedures I was confident that I would gain dependable and precise results. There is not a great difference between my first and second set of results, showing that they are reasonably accurate and reliable; although one anomalous result did occur. Also my results showing the percentage change follow the trend of my hypothesis, as the concentration of glucose increases the mass of the potato cylinders decreases. The amount of mass lost and gained by the potato cylinders was also fairly consistent, showing that the tests were carried out accurately.
After doing my experiment my method proved to be good enough to do what I wanted to do at the start of the investigation. However my method could have been improved by:
- Carrying out more tests to get more accurate results and better averages.
- Using a wider range of concentration e.g. 0.1m, 0.3m, 0.5m etc. this will enable me to get much more reliable results.
- Using scales which give readings to more decimal places. This will give accurate readings and will give me better averages and results.
Possible extensions:
- Investigating other types of vegetables and fruits to see if results are similar.
Although I did receive an anomalous result it did not affect my results. They strongly agreed with my prediction and had the correct trend and pattern which also supported the hypothesis which I have already stated. My conclusion and prediction were strongly supported, by the evidence which I collected from my results and averages.