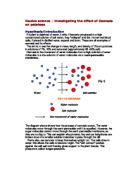
The difference between the water concentration in the potato and the 0.8 molar solution of sucrose is big, and the water in the potato should be transferred from the potato, through the permeable membrane, to the solution surrounding the potato. And as a result, I am sure that the weight of the potato will increase largely. And because the potato tissues are surrounded by a stronger solution, it will probably become smaller, and shrink. But because of such high molars of sucrose, the water can diffuse all the way, throughout the two substances, equalling the concentration gradient of the two substances.
My theory in this experiment is that, due to the difference in the water concentrations of the two substances, I believe that the weight of the potato will start decreasing when it is tested on 0.2 molar solutions of sucrose and greater. By researching information about osmosis, and making predictions of the results, I believe the graph would look something like this:
Fair Test
Fair testing should play a big part in this experiment. If this experiment isn’t a fair test, we will be obtaining the wrong results, which could lead us to the wrong conclusions.
First of all, and most importantly, we will have to get the measurements and the weights of the solutions and the potatoes as exact, and as accurate as possible. We will try and get the measurements of the potatoes as accurate as possible for every single potato, evenly cutting the potato pieces, and making a record of the length to the nearest millimetre. And we will be using a very sensitive balance so that we can get the best readings possible.
But I believe one of the most important steps in the fair testing is to make sure that the potato is fully covered by the solution. This is because the potato should fully submerge, by having total contact with the solution.
When using the balance, we will make sure that the balance is reading zero with the small foam bowl, before we put the 3 potatoes on it. This is so that we don’t get a false reading, with the weight of our potato with the reading it had before. And after the experiment, we will measure the 3 potatoes that should be dried as possible, and weigh it the same way, taking the reading to the nearest 2 decimal places.
And we will also be reading the measurements of the measuring cylinder by reading the bottom of the meniscus.
Carrying out the experiment in a constant temperature for the three hours of experiment is important. And to avoid temperature change, which might affect our 3 different sets of results, we will take the temperature of the solution into account.
Another important factor of a fair test is to start and stop the clock as quickly as possible. This meaning that we should start the clock as soon as the potato is put inside the petri dish, and stop the clock as soon as 20 minutes have passed. Stopping the clock, taking ‘em out and measuring it all in less than a minute us quite impossible because we lack the number of balances. And there are obviously too many sets to go through at such a fast time. Therefore, we will try our best to weigh the potatoes as quickly and as safely as we can.
Getting and experimenting with the exact measurements of molars and water is vital to this task. If the volume of one solution in a petri dish is higher or lower than another, will affect the pattern of results later on.
We will also make sure that the potato is fully covered by the 6 different kinds of solutions. This is because, is the potato isn’t covered up by the solutions, the effect of osmosis might not occur to the fullest.
Small things such as a dirty petri dish, and a slightly cracked measuring cylinder could still affect the results, and therefore we will take these into account as well.
Biological Aims
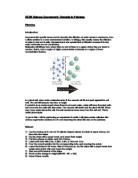
My main aim in this experiment is to find out if osmosis occurs in a potato, and how it affect the potato in different molar solutions of sucrose and water.
Risk Assessment
Safety is an important aspect in every experiment, even if the experiment seems to be very harmless. And that is why we take this into consideration, no matter what.
We will be using a very sharp knife, which could injure someone if it’s not handled properly. And we will also be careful that the solutions don’t get into our bodies internally, just in case, because we are not fully aware of the damage it could do to us.
But other than that, there weren’t any bigger matters to be cautious of.
Design of Experiment
I believe this task is very simple and should be very easy to carry out the experiment. The investigation is very straightforward.
There won’t be any control for this experiment, because the weight would vary depending on the potato pieces. And therefore, it might affect the results, which we are going to take in after the experiment.
First I will have to get the pieces of potatoes ready. I will push the cork borer through the potato, cutting it into long cylinders with a diameter of 10mm. And then I will cut the potatoes into cylinders of 30mm x 10mm x 10mm, and weigh 6 sets of 3 potato cylinders. I will have 6 sets because we will have to test the potatoes in 6 different types of solutions; 0.2, 0.4, 0.6, 0.8, 1.0 molar solutions of sucrose, and distilled water.
I will weigh each set and have them ready for us to put into the petri dish.
We will then get 25cm of the solutions and the water with help of the measuring cylinder, and pour them into the petri dish, naming them to make sure that they don’t get mixed up.
Then we will put the 6 sets of 3 potatoes in the 6 petri dishes at the same time and start the clock running for 20 minutes.
After 20 minutes, we will take all of the potatoes out of the petri dish, so that the actual osmosis action stops, and we will put the potatoes onto one piece of dry towel, in their own groups. We will dry them with the tissue paper, in sets of 3, and weigh and measure the potatoes taking in the average reading of the 3 pieces.
We will repeat the experiment three times so that we can make sure that all our results are similar, and so that we will be able to take the average of the 3 experiments. This makes sure that we get accurate results. Repeating the experiments are important, because we will be able to receive valid results, and looks for any anomalous results. Not to mention that we will take the fair testing into account.
The actual method will be: In the actual experiment, instead of using a cork bearer of 10mm diameter, we had to use a cork bearer of 8mm diameter. Although there was a change in plans, I don’t think this change would affect neither my hypothesis, nor my results that we got.
As for the experiment that we carried out, no changes were made in the experiment.
Table of results
In the table below, it shows the ‘solution’ columns, which are the 6 different types of solutions. The ‘number of test’ column, which shows the number of tests that took place, and the average of the three tests. The weight before and after the experiment represents the 3 sets of results and the average taken out of the three. The increase/decrease of the weight is calculated by taking the weight after, minus the weight before. The percentage increase/decrease of the weight of the potato is calculated by taking the weight increase/decrease divided by the original weight multiplied by a hundred. This should help us lead to a more accurate result, and the average percentage will be used to present the graph.
SOLUTION NUMBER WEIGHT INCREASE OR PERCENTAGE
OF TEST BEFORE (g) AFTER (g) DECREASE (g) (%)
DISTILLED 1 4.87 4.89 0.02 0.41
WATER 2 4.81 4.84 0.03 0.62
3 4.85 4.88 0.03 0.62
AVERAGE 4.84 4.87 0.03 0.55
0.2 1 4.85 0.00
2 4.83 4.84 0.01 0.21
3 4.84 0.00
AVERAGE 4.84 0.00 0.07
0.4 1 4.87 4.69 -0.18 -3.70
2 4.66 4.51 -0.15 -3.22
3 4.74 4.62 -0.12 -2.53
AVERAGE 4.76 4.61 -0.15 -3.15
0.6 1 4.87 4.63 -0.24 -4.93
2 4.86 4.57 -0.29 -5.97
3 4.88 4.55 -0.33 -6.76
AVERAGE 4.87 4.58 -0.29 -5.89
0.8 1 4.81 4.49 -0.32 -6.65
2 4.62 4.22 -0.40 -8.66
3 4.86 4.53 -0.33 -6.79
AVERAGE 4.76 4.41 -0.35 -7.35
1 4.64 4.23 -0.41 -8.84
2 4.86 4.51 -0.35 -7.20
3 4.80 4.39 -0.41 -8.54
AVERAGE 4.77 4.38 -0.39 -8.18
Analysis
On the graph shown below, I have made the ‘different solutions’ as my independent variable, since it won’t be changing on any event. And I have made the ‘percentage’ as my dependent variable, because it doesn’t change in any particular order or a pattern. I have decided to make it a bar graph, because the independent variables aren’t exactly in the same category. For example, I would have used a line graph if the independent variable in my experiment were time, which is changed deliberately, but these are different subjects of matter. And also, the results were very different, as well as the columns and there wouldn’t be any advantages of using a line graph to view the results. I have taken the average result of the 6 different solutions and put it on the graph to be more accurate.
Bibliography
Encarta (1999) CD Rom Microsoft
Roberts M., (1991) The Living World Nelson pp.
The Hutchison Educational Encyclopedia (1999)
CD Rom Epic Group Plc.
Bryan Telfer
Equipment
· 6 petri dishes – for all of the six solutions
· Marker pen – to label the petri dish, just in case of a mix up
· 8 250 cm Beakers – to pour the solutions into the petri dish
· Stop Clock – to time our experiment
· Cutting tile – to cut the potato on
· Knife – to cut the potato
· 25cm Measuring cylinder – to measure the solutions
· Distilled water – part of the experiment
· 2, 0.4, 0.6, 0.8, 1.0 molar solutions of sucrose – part of the experiment
· Potatoes – part of the experiment
· Tissue paper – to dry the potatoes after the osmosis takes place
· Balance – to weigh the potatoes
· Cork borer – to cut out potato cylinders