For my biology coursework I plan to investigate the affect of light intensity on photosynthesis. To achieve this I will change the amount of light exposure; my piece of Canadian pond weed gives off.
The rate of photosynthesis will be measured by me counting the amount of oxygen bubbles that the pond weed gives off. The light intensity will be my independent variable; the amount of oxygen will be my dependent variables.
I have chosen light as my independent variable because I know that light is needed to split the covalent hydrogen oxygen bonds in water which releases NADPH and oxygen partially as bubbles.
I was told that the amount of bubbles is directly proportional to the rate of photosynthesis.
To control the amount of the light that my pond weed receives, I will measure distances at which I will place my light source.
I am going to use Canadian pond weed because the oxygen produced by the pond weed will be in the form of bubbles in the water.
Hypothesis
I predict that the closer the source of light to the pond weed, the rate of photosynthesis would most definitely increase, even though I believe there will be a plateau at the top of the graph.
I also predict that after the plateau, at the start of the rate of photosynthesis will be inversely proportional to the distance of the lamp from the Canadian pond weed.
Apparatus:
- 60 watt lamp,
- Canadian pond weed,
- Safety goggles,
- Boiling tube,
- Beaker,
- Stopwatch,
- Scissors,
- Thermometer,
- Sodium hydrogen carbonate (1% w/u = 1g in 100ml)
Method
Fill the boiling tube with water and add 1g to the sodium hydrogen carbonate. Then place the Canadian pond weed using the tweezers. Then place the boiling tube in the water bath and take the temperature.
Then place the water bath in front of the light source and wait for the bubbling to star. If there is no bubbling then you must snip a piece off the top of the weed.
Place the light source at your chosen distances and count the bubbles for 1 minute each time.
The conditions that we had to use were the room had to be dark and the temperature of the solution was 19 degrees Celsius.
Diagram
Analysis
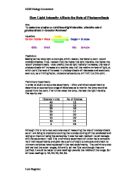
The graphs I have laid out are concave curves, which is what you would have to expect from graphs with direct proportion. The plots show and the lines show the results, on the distance/bubbles graph, you will be able to see that I have plotted an average as well as the previous three attempts. On the second graph you can see that I did no plot and show the previous three attempts because I felt that it was not necessary.
The curves on both of the graph show that the rate of photosynthesis never reached zero as I predicted in the hypothesis, this is because the room never was totally dark. The graph also shows that the rate of photosynthesis decreases as the light intensity gets lower. Also at the start of both of the graphs it only slightly displays a small plateau, and this proves that my hypothesis was correct. This shows that light but another factors like the temperature or the carbon dioxide concentration no longer limits the rate of photosynthesis. The plant shows the decrease in the rate of photosynthesis by it not producing as maybe bubbles per minute.
From this pair of results, I can definitely state that the light affects the rate of photosynthesis; the more light there is, the faster the rate of photosynthesis is. The faster the rate of photosynthesis is. This happens because light energy is needed indirectly to synthesise ATP from ADP. Oxygen is a by-product of this reaction that is not used by the plant but is excreted as waste, which I can measure because the higher the rate of photosynthesis, the more oxygen that is produced.
Evaluation
I feel that my hypothesis was correct and it backed up the results that I obtained. I think my results were good and suitable. As you can see from the results there was one anomaly; at the light intensity of 47 there was 37 bubbles produced, I think the amount of bubbles should have been a lower number then the line would have shown direct proportionality. Another major anomaly was shown in the distance graph at attempt 2, I think that at 12 CMS there should have been more bubbles produced then the line would have shown stronger direct proportionality.
I think that the reliability of the experiment was not as good as it could as an experiment, which I will describe. This is because you could miss-count the bubbles. Also the size of the bubbles will always change and be different. Because the room will never be totally dark with only one light on, the intensity will always change because of the sunlight and the amount of the lights in the room and this could be the reason for the anomalies I had. Although I think that the reliability of the experiment was not as good as it could be, I think that the experiment was not really that effected, and it wasn’t that much of a problem.
To make my results reliable and good I decided to do them three times and then take an average to produce the graph and from the graph I would say that my results were suitable and very reliable.
My results produced similar graphs to what I had hypothesised in my hypothesis. I feel that the distance graph was inversely proportional like I said in my theory and the intensity graph was directly proportional.
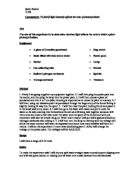
I did not get very accurate answers because some of the bubbles were bigger than the others. To make more accurate results I would use a more accurate method as shown below. As you can see the bubbles produced by the plant is automatically drawn up the capillary tube and then they congregated at the corner. After one minute I will pull back the syringe and this will draw one big bubble to the end of the syringe. Then I will be able to measure the bubble with a ruler. After knowing this information and the circumference of the capillary tube you can then work out the surface are therefore giving a more accurate result.
By Kieron Fenn.