Control:
The control will be made up of two experiments, one with and one without light. If the test with white light has too many bubbles to count the amount of sodium hydrogen carbonate will be reduced.
Constants- Light, carbon dioxide, temperature, and chlorophyll are all kept constant, meaning that even when there is surplus of every other variable, the rate of photosynthesis will be limited by these factors until there is an optimal amount of these factors to increase the rate of photosynthesis further.
Otherwise, the rate of photosynthesis can no longer increase. The bubbles are quite a large limiting factor, because they are different sizes and may be produced too fast to count, so human error can alter the results.
Prediction:
I predict that changing the wavelength of the light will not increase the rate of photosynthesis at a proportional rate. The control will be made up of two tests, one without light and one with natural light. If there are too many bubbles to count with the control, the amount of sodium hydrogen carbonate will be reduced.
Hypothesis:
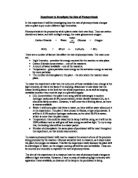
When chlorophyll absorbs light energy, the light energy cannot be immediately used for energy conversion. Instead the light energy is transferred to a special protein environment where energy conversion occurs. This happens by using the energy of a photon to transfer electrons from a chlorophyll pigment to the next. When enough light energy has been harnessed at a reaction centre, ATP can be synthesized from ADP. During this reaction, oxygen is produced as a by-product and it is the oxygen bubbles that are being measured in the experiment. Certain wavelengths should be easier to absorb than others, if this is true more light energy would be absorbed and transferred to fuel photosynthesis. The graph should look like this:
Method:
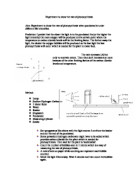
- Set up the apparatus as shown in the diagram above.
2. Fill the beaker with 450 cm3 of water and 50 cm3 of NaHCO3.
3. Select 1 piece of pond weed roughly 5-10 cm long and cut off the top of the weed.
4. Place the pondweed in the beaker.
5. Out a filter in front of the lamp, to get white light, or put a coloured filter in front of the lamp.
- Count the number of bubbles produced in 1 minute. Then repeat 3 times.
- In a 1-minute duration. Switch off the lamp and wait for another minute before taking another reading.
8. Change the colour filter and repeat the whole process 3 times again to get a good set of results.
Results:
The bubbles per minute, are the average number of bubbles rounded to the nearest whole number, because that is the greatest degree of accuracy we can measure to.
The values used for the wavelengths are the mid point values of each colour range
Analysis:
From the results that I have gathered I can state that certain wavelengths affect the rate of photosynthesis. As was also expected in my prediction, the relationship between wavelength and the rate of photosynthesis was non-linear. From the graph there is a best-fit curved line. This means that the rate of photosynthesis varies as the wavelength does. The results are almost correct, the results graph resembles the prediction graph, which means that the results we collected show that the wavelength affects the rate of photosynthesis. Our results were not exactly the same as the prediction graph, but several different things could cause this. Human error may have caused the results to be inaccurate. Some white light could have been used by the pondweed, causing the rate of photosynthesis to go up slightly. The heat being produced from the light may have also affected the rate of photosynthesis. Since temperature affects the movement of molecules and the reactions worked by enzymes, the heated molecules and enzymes may be the cause of the increasing rate of photosynthesis, because photosynthesis works using enzymes. This may account for why the number of bubbles being made was higher on the 3rd repeat, compared to the first repeat
The photosynthetic rate increases when you are testing certain wavelengths; this means that plants can absorb certain wavelengths better than others. Our results show that orange light was the wavelength (630-700 nm) that had the highest rate of photosynthesis. We also found out that green light (500-600 nm) is the wavelength that has the lowest rate of photosynthesis. This is correct, according to our prediction graph. The only anomalies in our results are for the red wavelength, these are as low as the green results, which is not right. If you compare the results graph to the prediction graph, you can see that the red wavelength should be much higher.
Evaluation:
Overall, I would state the experiment as a success since my predictions were supported by my results. Just as important is where the experiment was not a success and why. This photosynthesis investigation was probably not performed as accurately as it could have been due to some controllable and uncontrollable conditions. Some mistakes can be corrected.
While performing the experiment, the piece of pondweed did not photosynthesise at a steady rate when the distance from the plant to the light source was kept a constant. The third repeat was greater than the first reading each time, this may be because the lamp was heating the water, and causing the rate of photosynthesis to increase. While the number of oxygen bubbles was being recorded, the rate at which the plant was photosynthesising had increased. This may be due to the poor circulation of sodium hydrogen carbonate at the beginning of the experiment. Carbon dioxide may have initially limited the rate of photosynthesis.
The negative effects from this problem may be inaccurate data for some readings. These would show up on my graph. However, there seemed to be few anomalies than was expected when the experiment was being performed. Almost all readings were in correlation with each other and all of the anomalies were in the high photosynthetic rate end of the results. Seen as the anomalies were consistent, they shouldn’t really affect the averages, and they were not that obvious.
A large factor in determining data accuracy is the amount of human error during experiments. The rate at which oxygen bubbles were being produced by my plant was so high that I found it difficult to count the amount of bubbles. To overcome this is decided to cut the tip off the pondweed, and only count the bubbles that were produced at that point. To improve the accuracy of the results, the readings would have to be taken several more times. The entire experiment could have been performed again, and the new results could be combined if the same plant is used. But the rate of photosynthesis, of the same piece of pondweed would eventually decrease over time anyway. Repetitions would, improve the overall reliability of the results. We did three repeats, but even more would narrow the margin of error.
There are quite a few factors that could affect the results of my experiment. Some of these are variables that were mentioned earlier and could not be controlled, or they were variables that were not initially considered.
While performing the experiment, some of the oxygen produced from photosynthesis may have dissolved into the water. Some oxygen may have even been used by microorganisms living on the pondweed. The amount of oxygen dissolved or used by microbes is probably insignificant to my results since the degree of accuracy at which I measured was not high enough (this is because I could only count the number of bubbles, and they are not all the same size. Measuring the amount of oxygen produced would be a much more accurate method). Some oxygen is also used during the respiration of the plant. But since only bubbles were counted, the volume of bubbles was not as important. But to volume of oxygen produced is important, since it was volume in terms of bubbles that were measured. A change in bubble size was no accounted for when the results were analysed. For a more accurate analysis of the collected data, volume should have been measured instead of bubble quantity since the size of bubbles can vary. Using a capillary tube in place of the test tube so that the volume of each bubble could have been measured could have done this.
There are also factors affecting accuracy when testing the rate of reaction during no light. This should be zero, but you couldn’t count the bubbles without using light to see. The filter doesn’t wrap all round the beaker, meaning the pondweed receives some light energy from background light such as sunlight seeping through curtains or the light from the lamp of another student's experiment. To eliminate most all background light, the experiment must be performed in a completely dark room. Even then, some of the light from the lamp in my experiment would reflect of the table and reach the plant though this amount of light is probably insignificant in affecting the rate of photosynthesis.
Temperature was also another factor that was controlled by the lamp being used. Even though the filter was used in front of the lamp to prevent some heat from reaching the plant, not all the heat can be blocked. The extra heat, however, did not affect the temperature of the water, which stayed at between 29 and 30 C.
The method of the experiment could probably also be improved to obtain more reliable results. As already mentioned, the a capillary tube should be used in place of a test tube to accurately measure the volume of the oxygen produced. Due to the high rates of photosynthesis of the pondweed, readings should be taken within shorter time periods. I had originally chosen to count the number of bubbles in one minute but this produced miscounts in the readings. If during a repeated experiment, counting bubbles is still used, there is a smaller chance for human error when counting within a smaller time frame. If the capillary tube option was to be chosen, volume should be measured for a smaller time frame to reduce the overall time to complete the experiment. Also, during high rates of photosynthesis, it would still be difficult and impractical to measure the volume of oxygen produced for a long duration.
Due to the nature and convenience of the experiment, it could be easily modified to investigate another variable of photosynthesis. Since sodium hydrogen carbonate (NaHCO3) is used to provide the pondweed with carbon dioxide. Performing the experiment with different volumes of NaHCO3 could vary the amount of CO2. The plant would be kept at a constant distance from the lamp and a constant volume of water would be added to the sodium hydrogen carbonate.
Another experiment using almost identical apparatus would be to vary the intensity of the light the plant absorbs. Using a LVPSU (Low Voltage Power Supply Unit) you could vary the voltage going to the lamp, allowing you change the light intensity, like a dimmer switch. Since light intensity has already been identified as a variable of photosynthesis, it would be interesting to actually test it. The only way the measure the amount of light being produced by the lamp would be to use a Lux meter.