Preliminary Work
In our investigation we had to find out the value of the constants that we were going to use in our experiment. This included doing a series of investigations to see which were the correct values and what would produce the most reliable results. The things we were investigating were:
-
How much substrate (Hydrogen Peroxide)(H2O2) and how much water were we going to use?
- What was the best number of pieces of potato to use?
- How long were we going to time the experiment for?
- What size were the pieces of potato we were going to use?
- How big would the surface area be?
- What would the temperature be?
We had to solve some problems, for example, the Hydrogen peroxide wasn’t covering all of the potato so we had to make the amount of potato smaller. We had to do this because we couldn’t change the amount of substrate concentration because it all had to fit into a syringe and it was already completely full. This would also create a faster reaction because there is not so much potato that the substrate has to react with. Another problem we had to solve was that when you inject the Hydrogen Peroxide it would always push alot of bubbles out which went into the burette meaning we got completely wrong results. The solution to this was incredibly simple, all you had to do was wait for the bubbles to be expelled and then you could put the burette on the evacuation tube.
Accuracy and Values
We have a lot of values that we are keeping constant here they are:
- We had six values for Hydrogen Peroxide,
We measured this using a syringe it was accurate to the nearest 0.1ml.
We are going to repeat this 3 times so we can get an average and therefore a more accurate picture of the rate of reaction.
-
The amount of time we are giving the experiment is 3 minutes. We believe this will give the experiment enough time to show good reliable results that conform to the predicted pattern. We are using a stop clock that has an accuracy of 100th of a second.
- We are going to keep the temperature as constant as possible, but we are really at the mercy of the schools central heating system. We estimate that it will be around 20°c. we didn’t actually use anything to measure the temperature this could be one problem we have in our method.
- The size of our potato was 1cm³, we believed this would be a good size because it would react reasonably well and wouldn’t take to long to start reacting. We used a rule to measure this it was accurate to 0.1cm.
- We use 4 equally sized pieces of potato all of them were 1cm³ so the total surface area was 4cm³. We used the same rule so the accuracy was the same.
Equipment
We are using many different pieces of scientific equipment. Here is a list:
- A syringe.
- A boiling tube with a bung in to stop oxygen escaping and tube linking to the burette, which measured amount of oxygen produced.
- A beaker to hold the water.
- We also needed some distilled water to dilute the acid.
- We used a stop clock to time the experiment.
Method
To do the experiment effectively you have to follow a very strict set procedure so that you don’t mess the experiment up. You have to make sure everything is exactly the same at the start of each separate process so the investigation is fair and not bias in any way, which would produce bad results.
The first thing we had to do was make sure we had sufficient amount of all the equipment we needed. And all of it was clean and had not been used by anybody else. We cut up the potato into its 1cm³ pieces and put 4 pieces in the boiling tube. While the potato was waiting to be reacted we put it on tissue to stop anything getting on it which could affect the experiment. We then had to make sure that the potato would be covered by the substrate. We then sealed the boiling tube with the bung and placed the evacuation tube in the beaker full of water. After this we filled the burette with water and placed it in the beaker next to the end of the evacuation tube.
We then filled the syringe with the correct concentration of Hydrogen Peroxide and placed it in the hole in the top of the bung this creates an air lock so the pressure is constant. We now got the stop clock ready and started it once the syringe was compressed. Someone had to be holding on to the burette and wait for all the bubbles to pass out of the evacuation tube before we put burette on the tube to start measuring the Oxygen production.
We now waited 3 minutes for the reaction to take place and at the end measured how much oxygen was produced in ml. We had to carry each experiment out 4 times so that we could get an average meaning a better picture of the real results. This meant we had to do 24
Separate experiments, after each experiment we had to thoroughly clean all the apparatus so that it would not affect the results of the next one.
Obtaining Evidence
Data Analysis
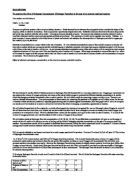
My graph starts off going up relatively steeply; it then begins to become gentler. It then starts to rise more rapidly again. This means the oxygen production is rising with the higher concentration of Hydrogen Peroxide. At the start there is almost no oxygen being produced there is then a pretty steep incline to the second value. This is because the oxygen production has more than doubled from 0.275ml to 2.050ml. There is quite a small gap between the next 3 values the gap is almost the same, about 0.5ml. It them suddenly jumps up again by more than 1ml. And by the end it is jumping 2ml at a time, from 4.2ml to 6.35ml. This is because there is a much higher substrate concentration and it is constantly rising. This is due to the collision theory, the higher the concentration the more likely and more quickly the enzymes are going to react with the substrate. The substrate will be colliding with the active sites more (lock and key). The results are slightly proportional they do follow the line of best fit reasonably closely. I used linear regression to workout the gradient and got y = 1.0686x – 0.665 this works out to a 40% gradient. The gradient is positive this proves my prediction. By doing the R² equation I have shown my results to be very accurate indeed. The R² equation shows by how much my results deviate from the line of best fit the closer to 1.00 the better. For my results it came out as 0.942, which is very accurate.
At the start there is not really anything to react with potato so the enzymes is not reacting. The potato shouldn’t really react at all, because there is not actually any substrate to react with. It is probably showing up as this because the beaker was shook or there may have been an air pocket that burst and changed our results. With the introduction of substrate the potato immediately starts to react. The active sites are beginning to get used. There is not much substrate to react so the rate of reaction is not that great, but it is increasing gently. Once there is a relatively high concentration of substrate in with enzyme, the collisions will start to go up making the reaction rate rise. This was particularly evident in the 5th and 6th values.
The findings are alot like my prediction in that the rate of reaction does go up with the substrate concentration but in another way they are very different. I said that the results would start to plateau at a certain point, but there has been no sign of this happening in my results. This could be because we were not allowed to use as much substrate as they would use in a lab. Or our substrate could not have been concentrated enough. It may even be human error. There are many factors that could have caused this to happen to my results. The real reason that the chart doesn’t resemble the prediction chart is that in my experiment I didn’t take the concentration high enough to show the limiting factors. It is still on the upward incline. Fundamentally my results are very accurate and do prove the prediction correct it just that as mention before the experiment wasn’t taken far enough to show this in the graph.
Evaluation
There were 3 results where if they were taken out the graph would be a perfect curve for substrate concentration against Rate of Reaction. 2 H2O2 + 3 H2O through to 4 H2O2 + 1 H2O are all anomalies which if taken out would create a perfect substrate against rate of reaction graph.
If you look in to it really deeply then you could find a lot of things that there were problems with the way that we did the experiment. For example when we put the H2O2 in the boiling tube, we let the gas that was already in there out this might have affected the results. The potato was cut the table it could have come into contact with a chemical that could potentially change the results of the investigation. Also because the potato was put on tissue sometimes to protect it the catalase in the potato could be absorbed and cause it not to create so much oxygen, slowing the rate. The experiments were conducted very quickly and we could have made a critical error at any time, which may have resulted in different results. E.g we might have not washed the tube thoroughly enough. People in the class were confusing the Hydrogen Peroxide with the water because they were both clear. They might have accidentally mixed the substrate with the water therefore diluting it. Meaning that when we diluted it, it would already be diluted ultimately resulting in completely messed up results, because the reaction would slow and not create the normal amount of oxygen for that concentration. Another reason for the results not really working is because our group split into two groups and one started at one end of the scale and the other at the other end. We also had to spread the experiment over two lessons, which surely must have affected the results.
I believe the evidence that I have collected is good for showing that the Rate of Reaction goes up with the substrate concentration. If the measurements we did were all put through a machine and made and the experiment was done under perfect conditions I believe we would have got the expected results and predicted graph. I believe that the results that I have collected are enough to strongly back up my conclusion because they are very accurate as shown by the R² equation. They do show the beginnings of starting to conform with my predicted graph and are only limited by the lack of a higher concentration substrate water solution. The gradient is positive, which exactly what I predicted.
I believe to further the evidence I have already discover I would have to do the experiment on more than one occasion and at different times of the year to see if the atmospheric conditions actually effect the results. It would show the true shape of the graph and whether it was actually reliable data. I could also investigate how temperature affects the rate of reaction this would mean I would have a broader view of how the rate is affected by changing conditions.