The Q10 rule can explain how the temperature of a reaction affects the rate of reaction. The equation to work out Q10 is:
Q10 = rate of reaction at (x + 10)oC / rate of reaction at x oC.
For enzymes, at a range of 0-40oC, Q10 is 2. This means that the rate of reaction is doubled for every 10oC rise and the time taken for the reaction is halved.
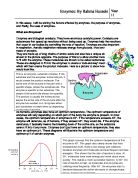
However, at very high temperatures, enzymes denature. The temperature just before the time when enzymes denature is called the optimum temperature, because this is the temperature where enzymes work fastest. Usually, this temperature is about 40oC. Here is a graph to show how the rate of reaction for enzymes in humans changes as the temperature changes:
The rate of reaction for enzymes can also be affected by pH. When the pH is too low and too high compared to its optimum pH, the enzyme also denatures. The optimum pH varies for each enzyme but most of the enzymes found in the stomach have a very acidic optimum pH, due to the acidic conditions of the stomach, and enzymes found in the small intestine have an optimum pH of about 7.5. Here is a general graph for how the rate of reaction changes as the pH changes:
Preliminary experiment
To get an idea on how to do my actual experiment, I carried out a preliminary experiment. I put some water into a beaker which was 28oC. I placed test-tube inside the water and in it I put in 4g of casein and 0.5g of trypsin. As soon as the trypsin hit the casein, I started the stopwatch and placed the test-tube in the beaker. I drew a cross on a piece of paper and placed the beaker on top of the cross. As soon as I could see the cross through the test-tube, I stopped the stopwatch and recorded the results. Then I repeated the experiment another two times but instead the temperatures of the water were 35oC and 40oC. These were the results that I obtained:
Materials and apparatus
Powdered milk solution – this will be the substrate. I will use 4g in 100cm3 water
Trypsin (enzyme) solution – this will be the enzyme which will act on the substrate. I will use 0.5g in 100cm3 water.
Distilled water – the test tubes will be placed inside the water.
Test-tubes – where the reaction of the milk and trypsin will take place.
Syringes – these will be used to add the trypsin and milk onto the test-tubes. More importantly, they will be used to measure out the volumes of milk and trpsin.
Thermometer – this will be used to measure the temperature of the reactions. However, when I am measuring the temperature, I will measure the water and not the solution of enzyme and substrate. This is because if I put it inside the reaction, when it is going in, it will mix the solution and this may make the reaction happen faster as the molecules will be moving around faster, which will increase the chances of successful collisions and will decrease the reaction time and increase the rate of reaction. The trouble with this is that I may not measure the exact temperature of the reaction as it may be different to the water. Therefore, I will need to take this into account in my evaluation.
Stop-clock – this will be used to time the reaction. The problem with this is that it will rely on how timely I can stop the stopwatch when the reaction has finished. Therefore, I will also need to take this into account in my evaluation.
Supply of boiling water – this will come from a water bath and this water will be used to heat up the reaction or to set the temperature for the reactions which will need a high temperature.
Ice – this will be used to cool down water which will cool down the reaction so that I can measure times for lower temperatures without having to wait too long for it too cool down.
Variables
Independent variable – this will be the temperature of the reaction. The temperature will need to be changed because I am investigating the effect of temperature on the rate of reaction for the reaction of trypsin and caesin. I will change it by either adding boiling water to the beaker in which the test tube with the enzyme and substrate is, to increase the temperature, or add ice to the beaker, to decrease the temperature of the reaction.
Dependant variable – this will be the time taken for the reaction to reach an end point. This is what the end point for the reaction will be. Firstly, I will draw a cross on a piece of paper. I will place the beaker with the test-tubes inside it on top of the cross. As the reaction starts to go clear after a while, I will stop the stopwatch when I can see through the reaction and onto the cross. I will do the same for each temperature.
Controlled variable – these are the things which I will need to keep the same during the reactions. Therefore, I will use 4g of milk and 0.5g of trypsin in 100cm3 of water for each reaction. This is to keep it a fair test. If I use more trypsin, then there will be more enzymes to break down the milk, so the rate of reaction will be quicker and the solution will turn clear quicker. If I use more milk, it will take the trypsin longer to break down the milk, as there will be more molecules of milk to break down, so the rate of reaction will decrease and the reaction will take longer to turn clear. I will also need to keep the pH of each reaction the same. This is because the pH can affect enzyme activity. If the pH is a lot lower or a lot higher than the optimum temperature for the trypsin, it may denature and the reaction will happen slower and the rate of reaction will decrease.
Method
-
I will put 100cm3 of water into a beaker and will make sure that the temperature of the water is at normal room temperature.
- On a piece of paper, I will draw a cross on it and place the beaker on top of the cross.
- In a test-tube, I will add 4g of milk. I will then add 0.5g of trypsin and as soon as the trypsin hits the milk, I will start the stopwatch and place the test-tube inside the beaker. These are the same amounts I used in my preliminary experiment and it got me good results so I will use the same amounts for the actual experiment.
- As soon as I can see the cross, I will stop the stopwatch and record the time.
- I will complete steps 3 and 4 another two times for the same temperature. I will have two repeats because in my preliminary experiment, I only had one repeat and I found it hard to make good conclusions so I will repeat the real one another two times so I can get more reliable results.
-
The temperatures which I will test will be 0oC, 10oC, 25oC, 35oC, 40oC, 55oC and 60oC. I will test 7 temperatures because in my preliminary experiment, I only used 3 temperatures and I found it hard to make a solid conclusion so I hope that with 7 temperatures, I can make better conclusions.
Safety
To keep myself safe during the experiment, I will wear safety goggles to ensure that no trypsin or milk enters my eye.
Prediction
I predict that as the temperature of the reaction between caesin and trypsin increases, the rate of reaction will increase. This is because as temperature increases, enzymes start to work faster and more efficiently. The reason for this is that when the temperature increases, the particles in the reaction have a lot more energy. This energy is kinetic energy, which makes the particles in the reaction move around mush faster. This means that they collide together much more often. This also increases the chances of successful collisions. For this reaction, a successful reaction is one in which the substrate fits into a depression of the right enzyme. For this experiment, the substrate is caesin and the enzyme is trypsin. The shape of each caesin molecule is complementary to the shape of the depression in the trypsin enzyme, which is called the active site. So when each caesin molecule fits into the active site of the trypsin, the trypsin breaks up that caesin molecule. So if this break down happens more often during the reaction, the overall reaction happens faster. So if the molecules are moving around faster due to the temperature increasing, there are more collisions so there is more of a chance of each caesin molecule fitting into a trypsin enzymes active site so the reaction happens faster. If the time taken for a reaction decreases, then the rate of reaction increases. Therefore, I predict that as the temperature increases, the rate of reaction increases.
RESULTS
Result = anomaly
ANALYSIS
From my two graphs, I can conclude that as the temperature of the reaction increases, the time it takes for the reaction decreases and the rate of reaction increases. This is because as the temperature increases, all the molecules in the reaction have more energy, and move around faster, which increases the chances of collisions, so the enzymes will break down more molecules.
Graph 1 shows that as the temperature increases, the time it takes for the reaction decreases. This clearly means that the reaction is happening faster as it is taking less time to complete. This shows that temperature does indeed make a reaction happen faster.
Graph two shows how the rate of reaction increases as the temperature increases. The graph clearly shows that temperature increases the rate of reaction. This therefore makes the reaction happen faster. In this graph, there was an anomaly. However, I will comment about this in my evaluation.
I found that as the temperature increased, the rate of reaction also increased. However, it increased at an increasing rate. This means that as the rate was increasing, it was increasing by more each time. This does exactly what the graph in my plan shows, however, the peak rate should be at 37oC, but in my graph, the peak is at 60oC. One explanation for this could have been that the enzyme I used in my experiment was not an enzyme which is used by an actual human body, so its peak temperature could have been much higher, which would explain the results.
Also, I measured the temperature of the water and not the reaction so the optimum temperature of 60oC may not have been so, because the enzyme was not at 60oC, and instead, only the water bath was.
The reason that the rate of reaction was increasing as the temperature was increasing can be explained by the collision theory. When the temperature of the reaction is higher, the enzymes have more kinetic energy as they are moving around faster. Because of this, the molecules in the reaction collide more frequently, as there is a greater chance of this happening due to the fact that they have more kinetic energy. This means that of there are more collisions, there is a greater chance that a substrate will fit into the active site of the enzyme which acts on it. This means that more products are formed more quickly and the reaction happened faster.
As we saw from my results, as the reaction time is reduced, i.e. as the reaction happens faster, the rate of reaction also increases. Therefore, from this I can conclude that as the temperature of a reaction increases, the rate of reaction also increases.
However, enzymes after a certain temperature denature. This means that they lose their shape and their active site changes so that it is no longer complementary to the substrate. This means that the substrate cannot fit into the active site, and no reaction takes place. Therefore, for enzymes, after the optimum temperature, they start to denature so this means that the time it takes for the reaction to happen increases, as there are less enzymes working properly. This therefore reduces the rate of reaction and the rate reaches 0 when each enzyme in the reaction is denatured. The graph below shows this clearly:
EVALUATION
Overall, I thought that my experiment was not very successful. This is because the results did not follow any enzyme theories.
However, I thought that the procedure was suitable for the investigation. For example, I was using the right enzyme for the right substrate, i.e. trypsin on casein. I thought that drawing a cross to see when the reaction was over was a good idea because it gave me the chance to record a result without waiting too long for it. However, this could have changed some of the results, because it depended on when I thought the reaction had ended, and not when it had actually ended. However, I only found one anomaly from my results for 25oC, but it did not affect the line of best fit at all.
The equipment could have increased or decreased the amount of enzyme and substrate I put in the reaction, but this would have been such a small difference, that I doubt it could have affected the results greatly. For example, if I measured and put in a little bit more of trypsin than was needed, there would have been more enzymes which would have broken down more substrate which could have decreased the reaction time, thus increasing the rate of reaction.
Also, I had one anomalous result. I thought that it was anomalous because a long way off the line of best fit. This could have been caused by a human error during the reaction. This may have been because I measured the temperature, and then waited a long time before starting the reaction, so the reaction could have cooled down and the reaction time could have been changed.
One way I could have improved the experiment would have been to found a better way of finding when the reaction had ended. The way I did it was to draw a cross under the beaker, and when I could see the cross, measure the time and record it. However, there were problems with this which I have mentioned above. A way I could have improved this method would have been to let the reaction finish completely before recording the result.